Tuesday, June 7, 2022

10F Increment Low Temperature Days per Year

This is the companion to the 10°F high temperature post. It shows the number of days per year with low temperatures in each 10F temperature range. 


10F Increment High Temperature Days per Year

These maps show the number of days per year in 10°F temperatures. For example, the map titled "Days With a High Temp in the 90°Fs" represents the average number of days with a high temperature between 90°F and 99°F - NOT 90°F AND ABOVE. This last part tends to cause a lot of confusion. Any number of people have made maps of days with a high of 90°F or greater, but these are the first maps that slice it into 10°F segments. 


Friday, May 20, 2022

Severe Weather Time of Day


*** This blog was originally posted in April 2015. This analysis was updated in May 2022. ***

When are severe thunderstorms most likely to occur? This is a question of great interest to forecasters, researchers, and emergency management personnel.

A number of sites contain bar charts or broadly generic maps with severe weather frequency (see here and here). However, a detailed temporal climatology does not appear to exist. Therefore, I present these maps as a jumping off point for continued discussions.

The Storm Prediction Center (SPC) has an wonderful archive of past severe thunderstorm climatology. Their database was used exclusively in the development of these severe weather climatology maps.

Severe Weather Definitions

Before we get started, here is what defines "severe weather" and therefore included in the SPC database.

1) Wind gust in excess of 50 knots (associated with a thunderstorm)
2) Hail 1" or greater in diameter (>25 mm)
3) Tornado

In addition to the severe criteria, I restricted the analysis to the May - November period and from 10 a.m. to 3 a.m. 

The SPC database contains hundreds of thousands of events as a series of points and lines. Each record in the database is assigned a latitude, longitude, and time of occurrence. Since an event with a beginning and ending coordinate (a line) is only assigned a single time stamp, I decided to assign the time to the beginning coordinate and treat the event as a discrete point.

Unit of Time

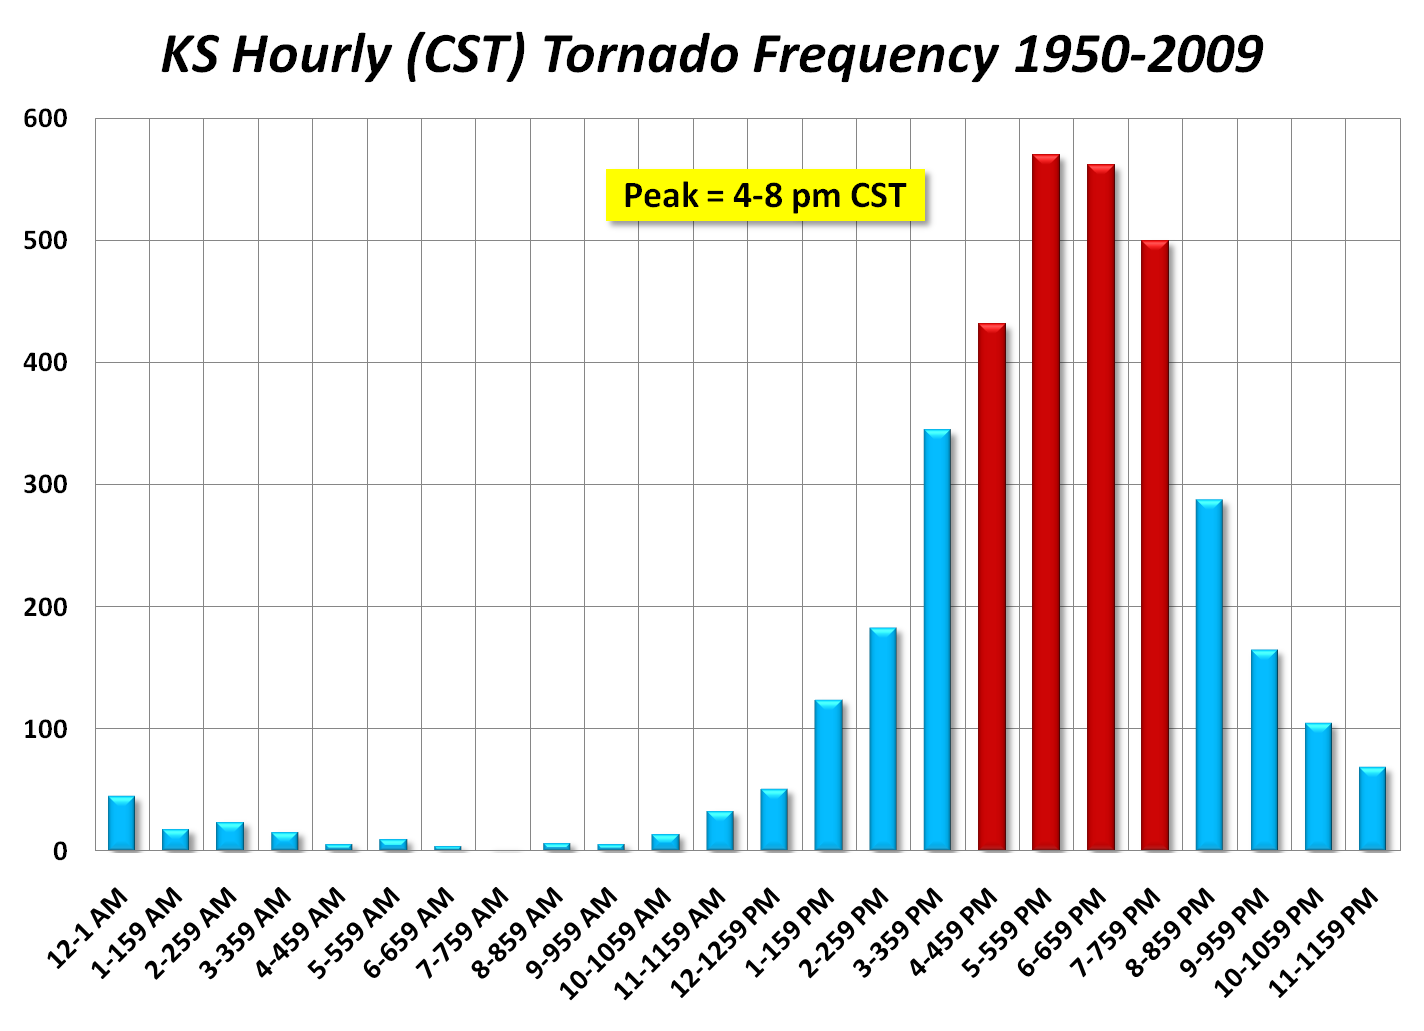
Every chart that I have come across relating severe weather to a time of day uses clock frequency. In the example from the NWS Wichita office, they determined that the 5:00 p.m. - 5:59 p.m. hour is the most likely hour to observed a tornado in their region. While this is useful information, it is not applicable to all places. Imagine two cities with an identical tornado climatology, but at opposite sides of a time zone. They have a chart that is an hour different – even though the peak may be exactly the same. Next, the time of peak solar energy is not the same from day-to-day. It changes by nearly 30 minutes over the course of a year. The Equation of Time describes the changes in the time of solar energy. Since the primary source of energy that drives severe thunderstorms is diurnal solar input, knowing the exact solar parameters for an event is crucially important.

A simple relationship exists between the longitude and the time of solar noon (when the sun is at its maximum elevation above the horizon). This value is easily computed from the date and the longitude entries in the severe weather databases. A correction based on the Equation of Time is then applied the the solar noon calculation. Finally, the solar noon time is subtracted from the event time to come up with our units. For example, if a city's unadjusted solar noon is 12:30 p.m., the Equation of Time correction for that date is -0:15, and a severe hail storm hit at 4:45 p.m., the event is computed as occurring 4.5 hours after solar noon. Therefore, severe weather times of occurrences are described as hours after solar noon.

Data Processing

Since solar energy is the main, but not exclusive, driver of severe weather, I took the liberty of removing some events. Specifically, all events in the months of December, January, and February were excluded. Also, events that occurred between 3.5 and 8.5 hours before the computed solar noon were removed. Here's why. If an event happened at 6 a.m. on a day where solar noon was computed as 12:00 p.m., did the event happen 6 hours before solar noon or 18 hours after yesterday's solar noon? This is a difficult question to answer. So, I just removed 5 hours worth of observations and made the problem go away.

For each data set (tornado, hail, and wind) I made a density grid for the entire U.S. using 35,000 meter grid cells. if a grid cell had at least 4 events during the period of record, it was kept for analysis. This leaves out most of the area west of the Rocky Mountains.

Next, an average value of the time past solar noon for all events in each grid cell was computed. In it's raw form, this makes the map look quite chaotic. To make it aesthetically pleasing, I ran a 5x5 mean filter across the data sets.

Maps

The following three maps were generated using the process described in the preceding section.

Figure 1. Average time of occurrence of all severe thunderstorm-generated wind events. Time is hours after solar noon.

Figure 2. Average time of occurrence of all large hail events. Time is hours after solar noon.

Figure 3. Average time of occurrence of all tornado events. The time is assumed to represent the point of initial tornado touchdown. Time is hours after solar noon.

Figure 4. Average time of occurrence of all severe weather events. Time is hours after solar noon.


Analysis

I was quite surprised at the time variability in Figures 1 & 2 in particular. Why are storms more likely to occur several hours later in the day in the Great Plains versus the eastern 1/3 of the U.S.? Why are severe wind events so much later in the day? I think that discrete storms that produce large hail and tornadoes tend to "evolve" into more linear wind producing features. MCSs are also more likely to get started later in the day and the distance from the Rocky Mountains in non-trivial.


Monday, January 24, 2022

Winter Season Severity Index (AWSSI) Trend: Lower 48

I've written about the Accumulated Winter Season Severity Index (AWSSI) before (Mayes Boustead et al., 2015). It's perhaps the only tool to fully encapsulate the intensity/severity of a winter season. It is not perfect, but it's more than sufficient to conduct assessments and comparisons between locations and between seasons.

Quick recap, during the winter, you accumulate winter severity points (AWSSI points) for low temperature, high temperature, new snowfall, and snow depth each day. The more wintry the value, the more points it gets. Table 1 shows the values that can accumulate daily based on the magnitude of the climate variables. Over the course of the season across the entire U.S., the low temperature column is where 46% of the season's points accumulate. Snow depth accounts for 34%, high temperature accounts for 12%, and snowfall accounts for 8%. In more southerly latitudes, most points come from the low temperature.

Table 1. AWSSI point values.

Maps:

The following figures were generated for the 1948-49 to 2020-21 winter seasons using all available station data in the GHCN-D climate database. As long as a station had no fewer than 7 missing days for the October-April time period, it was included. There was no minimum number of years for inclusion. For each year, all qualifying stations were used. Some years had more available stations than others. On average, 2000-4000 stations were used in each year's analysis. 1948-49 was selected as the start year because there was a significant increase in U.S. station density beginning in 1948. 

For seasonal average, maximum, and minimum, I used an inverse distance weighted (IDW) algorithm with 15 kilometer grid cells. For trend analysis, I used 150 km grid cells because there is sufficient noise between neighboring stations to require a broader generalization.

Note: this is a Lower 48 analysis only (for now) because large data gaps, and because the lack of Canadian snowfall / snow depth data leave odd artifacts behind.


Figure 1: 1948-49 to 2020-21 average.


Figure 2: 1948-49 to 2020-21 maximum seasonal value.


Figure 3: 1948-49 to 2020-21 minimum seasonal value.


Figure 4: 1948-49 to 2020-21 change in AWSSI points (raw point values). Trend is the difference between the beginning and end points of a linear regression line (150 km grid cells).


Figure 5: 1948-49 to 2020-21 change in AWSSI points (as a percentage). Trend is the difference between the beginning and end points of a linear regression line divided by the starting value times one hundred (150 km grid cells).


Figure 6: 1948-49 to 2020-21 average length of winter in days. The beginning of winter is defined as the date of the first measurable snow, first daily max temp ≤ 32°F, or December 1st – whichever is first. The end date is the last day with measurable snow, the last day with snow on the ground, the last day with a max temp ≤ 32, or February 28/29 – whichever is latest.


Figure 7: 1948-49 to 2020-21 change in the length of winter. Trend is the difference between the beginning and end points of a linear regression line divided by the starting value times one hundred (150 km grid cells). The beginning of winter is defined as the date of the first measurable snow, first daily max temp ≤ 32°F, or December 1st – whichever is first. The end date is the last day with measurable snow, the last day with snow on the ground, the last day with a max temp ≤ 32, or February 28/29 – whichever is latest.


Figure 8. All qualifying stations used in the analysis depicted in all figures.


Video 1. Each year's AWSSI value from 1948-49 to 2020-21. 


References:

Mayes Boustead, B.E., Hilberg, S.D., Shulski, M.D. and Hubbard, K.G. (2015) The accumulated winter season severity index (AWSSI). Journal of Applied Meteorology and Climatology, 54, 1693–1712. https://doi-org.uaf.idm.oclc.org/10.1175/JAMC-D-14-0217.1.

Ford, T. W., Budikova, D., & Wright, J. D. (2021). Characterizing winter season severity in the Midwest United States, Part I: Climatology and recent trends. International Journal of Climatology, 1– 16. https://doi-org.uaf.idm.oclc.org/10.1002/joc.7431

Wednesday, July 7, 2021

Anchorage Termination Dust

Background

Here in Anchorage, there is a local term for the first snowfall of the season that falls on the nearby Chugach Mountains – Termination Dust. According to the Dictionary of Alaska English (see Fig. 1), it represents the end-of-summer snow that falls on the surrounding mountains. The term appears to have originated, or was at least popularized, in Anchorage. That said, the first known published use of the term was in 1953 in the Fairbanks Daily Newsminer (Fig. 2).

As the air begins to cool for the season, the freezing level gradually drops. Occasionally, it drops low enough to cause snow to form at the elevation below the surrounding peaks. Fig 3 shows the percent of the time that the weather balloon launched twice daily in Anchorage is less than or equal to +1°C (34°F) at the 850 mb geopotential height (approximately 4,700' in August). This is a temperature where it's cold enough for precipitation to fall as snow. On July and August days when this happens, the average elevation of the 850 mb height level is 4,600'. When precipitation is falling, that cold air is dragged lower down in the atmosphere hundreds of feet. 

If you ask the average Anchorage resident, the most common description of Termination Dust is the snow that marks the beginning of the end of fall. It's a marker for people to do the things necessary to get ready for the upcoming winter.

Criteria

OK, so that's a little of the background. Now, as an Anchorage-based climatologist, EVERY SINGLE YEAR, when snow first hits the peaks, I get asked "is this Termination Dust?" My first response is that there is no one definition. Everyone has their own idea of what it is. Does a coating along the top of the mountains in July count? What about the snow that frequently dots the top of Pioneer Peak above 6,000' as seen during the Alaska State Fair in August? Is that Termination Dust?

Without a consistent definition, there's no way to track how it changes over time. As our climate warms, we'd like to have some data to show how this aspect of the climate responds to increasing temperatures. The Nenana Ice Classic and Fairbanks green-up are some other Alaska-specific seasonal markers that we note the annual trends of because someone took the time to mark down when they occurred.

As a climate scientist and a long-time Anchorage resident, I have given this a fair amount of thought over the years. Here are my criteria for Termination Dust:

1) Must occur on or After August 1st. Period. Since it represents the beginning of the end of summer, it makes no sense to allow a snow that occurs before peak summer temperatures typically occur (mid to late July). Inspection of Fig. 3 shows that early August is when the atmosphere at 4,000' to 5,000' begins to cool off.

2) There must be a solid snow cover above 4,000' as viewed from Midtown Anchorage across most of the front range. There should be no ambiguity. If one person thinks it's Termination Dust and another does not, it probably isn't. I chose 4,000' for the solid snow because most of the tops of the mountains in the Chugach Mountain front range that you see from town go above 4,000'. At this elevation, more that 50% of the mountaintop horizon is covered. Photo 1 has an annotated drone photo showing Front Range peaks with their elevation values and where the 4,000' line is as viewed from south Anchorage. [The perspective from other parts of town will be different.]

Photo 2 is also a drone photo with an approximately 3,800' snowfall from 2020. Photos 3 and 4 show a near Termination Dust right at 4,000'. Photos 5 & 6 show lower elevation snows. These lower elevation snows are too low to be a requirement to count as Termination Dust, but if it's the first event, they obviously count. Remember, this is an Anchorage-specific definition. Many places across Alaska now incorporate the Termination Dust terminology to describe their local first mountain snow. 

Alternatively, any accumulating snow down to 3,500' should count. At this elevation, Flattop Mountain gets snow.

3) The snow must hang around for at least 12 hours and still cover most of the areas half a day later. If it snows and then quickly melts due to sun, warm temperatures, or rain, then it doesn't count. You need several inches of snow to survive half a day hours from mid-August to mid-September at 4,000'. Since there are no trees above this elevation, the snow is sitting on bare ground.

4) There is only one Termination Dust event per season. By definition it is a "first" event. If there's a Termination Dust, then it melts away, and another event comes along two weeks later that looks exactly the same, only the first one counts. 

Examples: Are the following First Snows Termination Dust?

A) A 4,000' solid snow cover across the horizon on July 15th. Not Termination Dust

B) Snow dots the tops of the 5,000' peaks (e.g., O'Malley Peak, South Suicide Peak) on August 15th. Not Termination Dust

C) Snow covers the peaks in the Eagle River valley on September 1st above 4,000' but not the peaks visible from Midtown above 4,000'. Not Termination Dust (for Anchorage)

D) Heavy snow covers the Front Range at Flattop Mountain elevation and persists until the next day. Termination Dust

E) A light accumulation of snow covers the Front Range at Flattop Mountain elevation but melts out a few hours later. Termination Dust.

F) Heavy snow covers areas above 4,000' for several days and then melts out but no one sees it because it's in the clouds the entire time. Not Termination Dust

G) No snow in the mountains all Fall, but then snow falls everywhere down to sea level on October 1st. Termination Dust

Remarks

Even with a somewhat formal definition outlined above, there will still be some subjectivity. Perhaps a consensus by observers at the National Weather Service in Anchorage can make the "call" just as they do in Fairbanks for green-up.

Photos


Photo 1. Chugach Mountain peaks as viewed from south Anchorage (Abbott Rd.) with names annotated. Bottom panel shows approximate area covered by snow at 4,000' from this perspective. Photo credit: Brian Brettschneider.


Photo 2. Similar perspective as Photo 1, but with actual snow near the 3,800' level. Photo credit: Brian Brettschneider.


Photo 3. Snow level at 3,800'. Snow is covering Kanchee, Konoya, Tikishla, and Wolverine Peaks. Far peak on right (no snow) is Rusty Point. Photo credit: Brian Brettschneider.


Photo 4. Snow level at 3,900'-4,000'. Snow is covering O'Malley Peak, The Wedge, Ptarmigan Peak, Peak 3, and South Suicide Peak. Photo credit: Brian Brettschneider.


Photo 5.  Snow level at 3,500'. Snow is covering Kanchee, Konoya, Tikishla, and Wolverine Peaks. More area between peaks is snow covered than in Photo 1. Photo credit: Brian Brettschneider.

Photo 6.  Snow level at 3,000'. Snow is covering Wolverine Peak, O'Malley Peak, The Wedge, and Flattop Mountain. The snow is nearly unbroken from horizon-to-horizon. Photo credit: Brian Brettschneider.


Figures


Fig 1. Article from Aug 25, 1969, Anchorage Daily Times. It attributes the term to a man named Ken Sheppard from 20 years prior (~1949). 


Fig 2. Definition of Termination Dust from the Dictionary of Alaska English (Tabbert 1991). Thanks to Annie Zak for the image ( https://twitter.com/annie_zak/status/779465428217176064 ). 


Fig 3. Early reference to Termination Dust from the September 22, 1953, Fairbanks Daily Newsminer. Thanks to Rick Thoman for the image ( https://twitter.com/AlaskaWx/status/779486539923337216 ). 


Fig 4. Percentage of the time that the 850 mb temperature in Anchorage is ≤ 1°C (<34°F).

Acknowledgements: A very special thank you to Rick Thoman for the research resulting in Fig. 2, the suggestion for Fig 3., and as a sounding board for ideas.

**********************************************
Termination Frost?

Is there such thing as Termination Frost? The first time of the year there is a little frost on a car windshield, people note it as the first frost of the year. From a growing-season point of view, I would argue that there needs to be significant coverage of frost on grassy (or low-lying) vegetation at a location for it to be considered Termination Frost.

**********************************************

Dates:

1956-1991: Anchorage Daily Times

1956: September 19th
1957: September 27th
1960: September 23rd
1967: September 5th
1970: September 18th
1971: September 6th
1972: September 14th
1974: August 25th
1978: September 13th
1979: August 29th
1980: August 20th
1981: September 22nd
1982: September 2nd
1983: August 21st
1988: September 4th
1991: September 7th


2008-present: Records by Brian Brettschneider

2008: September 26th
2009: September 22nd
2010: September 26th
2011: September 20th
2012: September 5th
2013: September 19
2014: September 29th
2015: August 29th
2016: September 22nd
2017: October 5th
2018: September 24th
2019: September 23rd
2020: October 12
2021: September 15th
2022: September 9th
2023: September 6th
2024: September 27th
2025: September 24th
2026: August 31st

2008-2026 Average: September 19th
2008-2026 Median: September 22nd