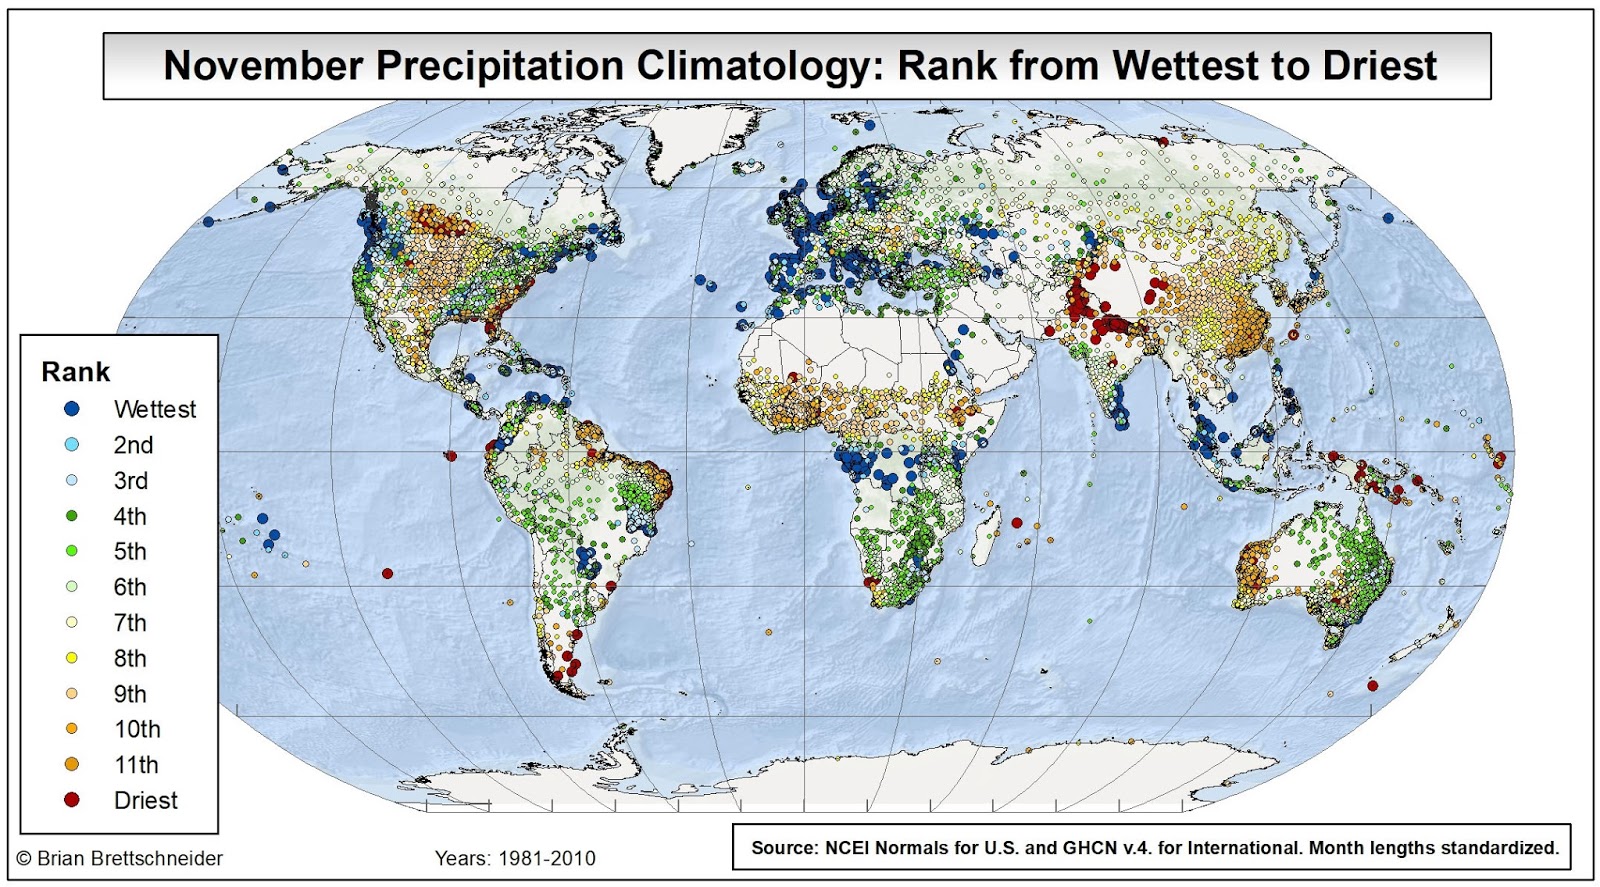
In an earlier blog post, I looked at which months (and seasons) were the wettest and driest for thousands of stations across the U.S. In each case, just the wettest and just the driest months were identified. What if we want to know how each month of the year ranks in terms of wettest to driest? The map set below answers that question.
For each of the twelve months of the year, a rank from wettest to driest was computed for each station in North America. Importantly, month lengths were standardized. This negates differences in the lengths of months. For example, a February that averages 3.00" of precipitation will "outrank" a March that averages 3.01" of precipitation since the per-day average of February is greater. All station data is based on the 1981-2010 time period. For U.S. stations, the values come from the NCEI published normals. For international stations, data come from the GHCN version 2 data set.
Maps:


No comments:
Post a Comment