The following maps show the normal daily high temperature, normal daily low temperature, normal daily standard deviation, monthly precipitation, and monthly snowfall for the month of April. There's really not a lot of additional information to add.
Friday, March 28, 2014
Snowiest Month
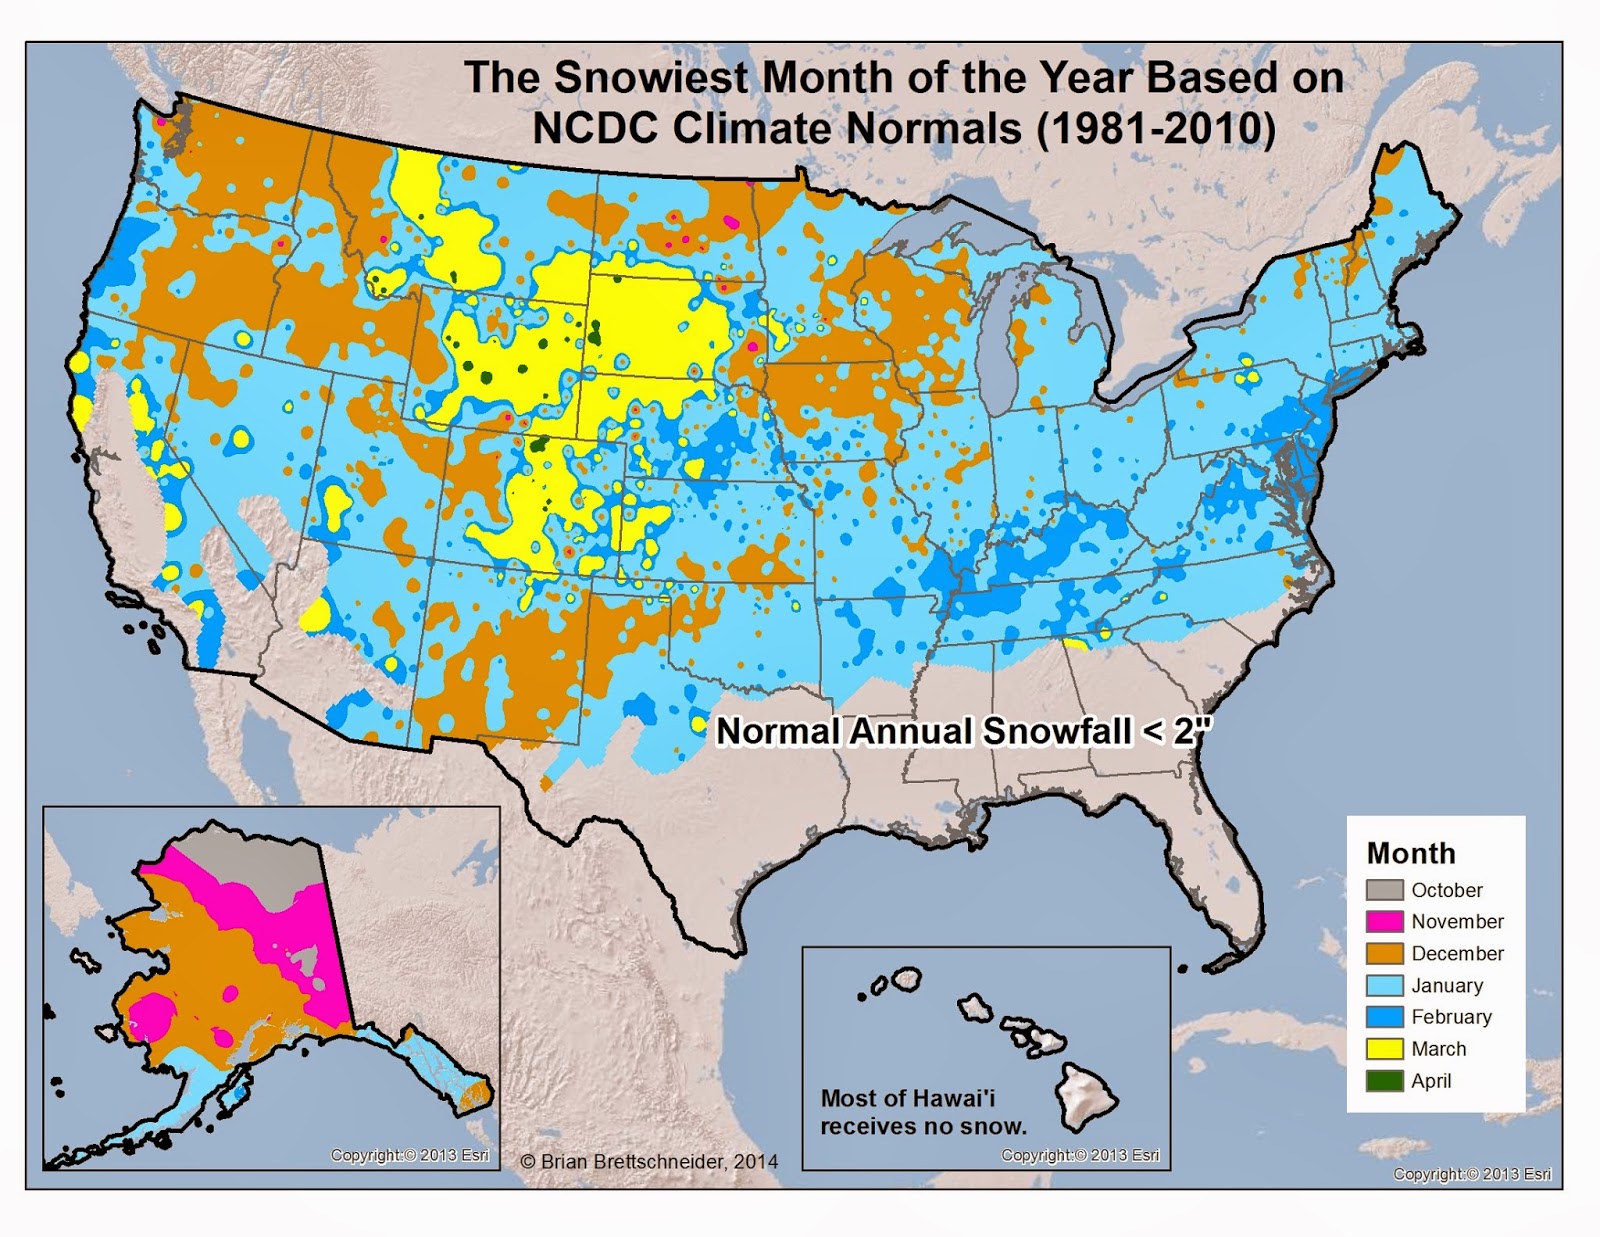
Not only is snow still common this time of year, in some places the snowiest month of the year lays ahead. The first map below, Figure 1, shows the month of the year with the highest normal (1981-2010) snow total. The second map, Figure 2, shows the stations where April is the snowiest month of the year. Many stations in the central Rocky Mountains and the Upper Great Plains see their peak annual snowfall in March and April. There are several reasons for this - including a change in mean wind direction and the greater likelihood of a leeside troughs forming in Colorado producing upslope, moist flow.
Figure 1. Month with the greatest normal snowfall according to the 1981-2010 NCDC climate normals. Stations must receive an annual total of 2" or more to be included in the analysis. Stations with ties for different maximum months were not included. These are generally stations with very low snow totals.
Figure 2. Stations whose greatest normal snowfall, according to the 1981-2010 NCDC climate normals, occurs in the month of April.
Wednesday, March 26, 2014
Late Snow
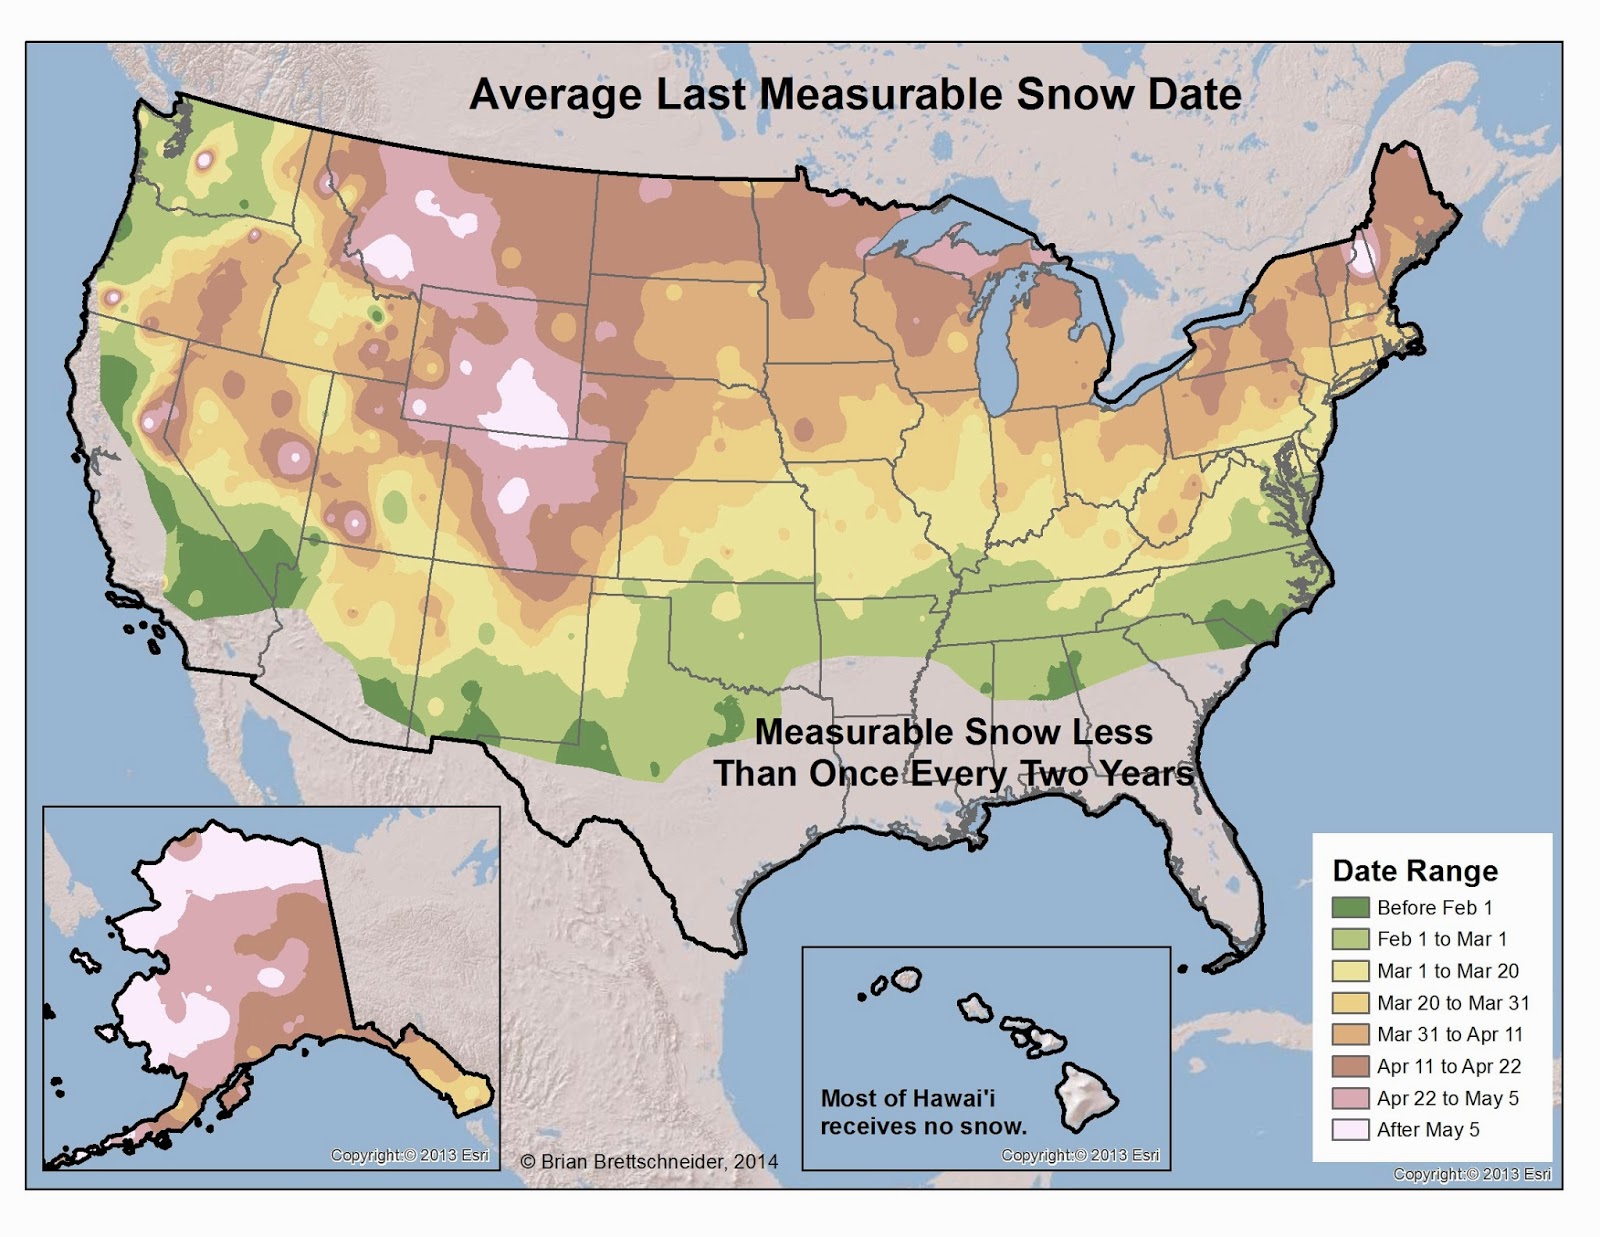
Every year when a late-season snowfall blankets some portion of the nation, many wonder exactly how unusual it is. In short, the answer is that late season snows are the norm, not the exception. The three maps below show 1) the average date of the latest measurable snow, 2) the latest date on record with a measurable snow, and 3) the greatest snow amount after April 1st.
Figure 3. The largest calendar-day snow total for any day between April 1 and May 31. All stations with snow records were used.
Figure 1. Average date for the latest measurable snowfall in a season. Seasons with 15+ years of data that receive measurable snow in a majority of years were used.
Figure 2. The latest ever date with measurable snow. Seasons with 15+ years of data that receive measurable snow in a majority of years were used.
Temperatures in the 70°s
The other day I saw some posts that referred to ideal temperatures in the 70°s. While all temperature preferences are subjective, I felt it would be interesting to see which areas have the most 70°F days per year. By this metric, the coast of California is the clear winner for 'ideal' weather days. This did not look at precipitation as the data for precipitation has many instance of 0s where data is actually missing.
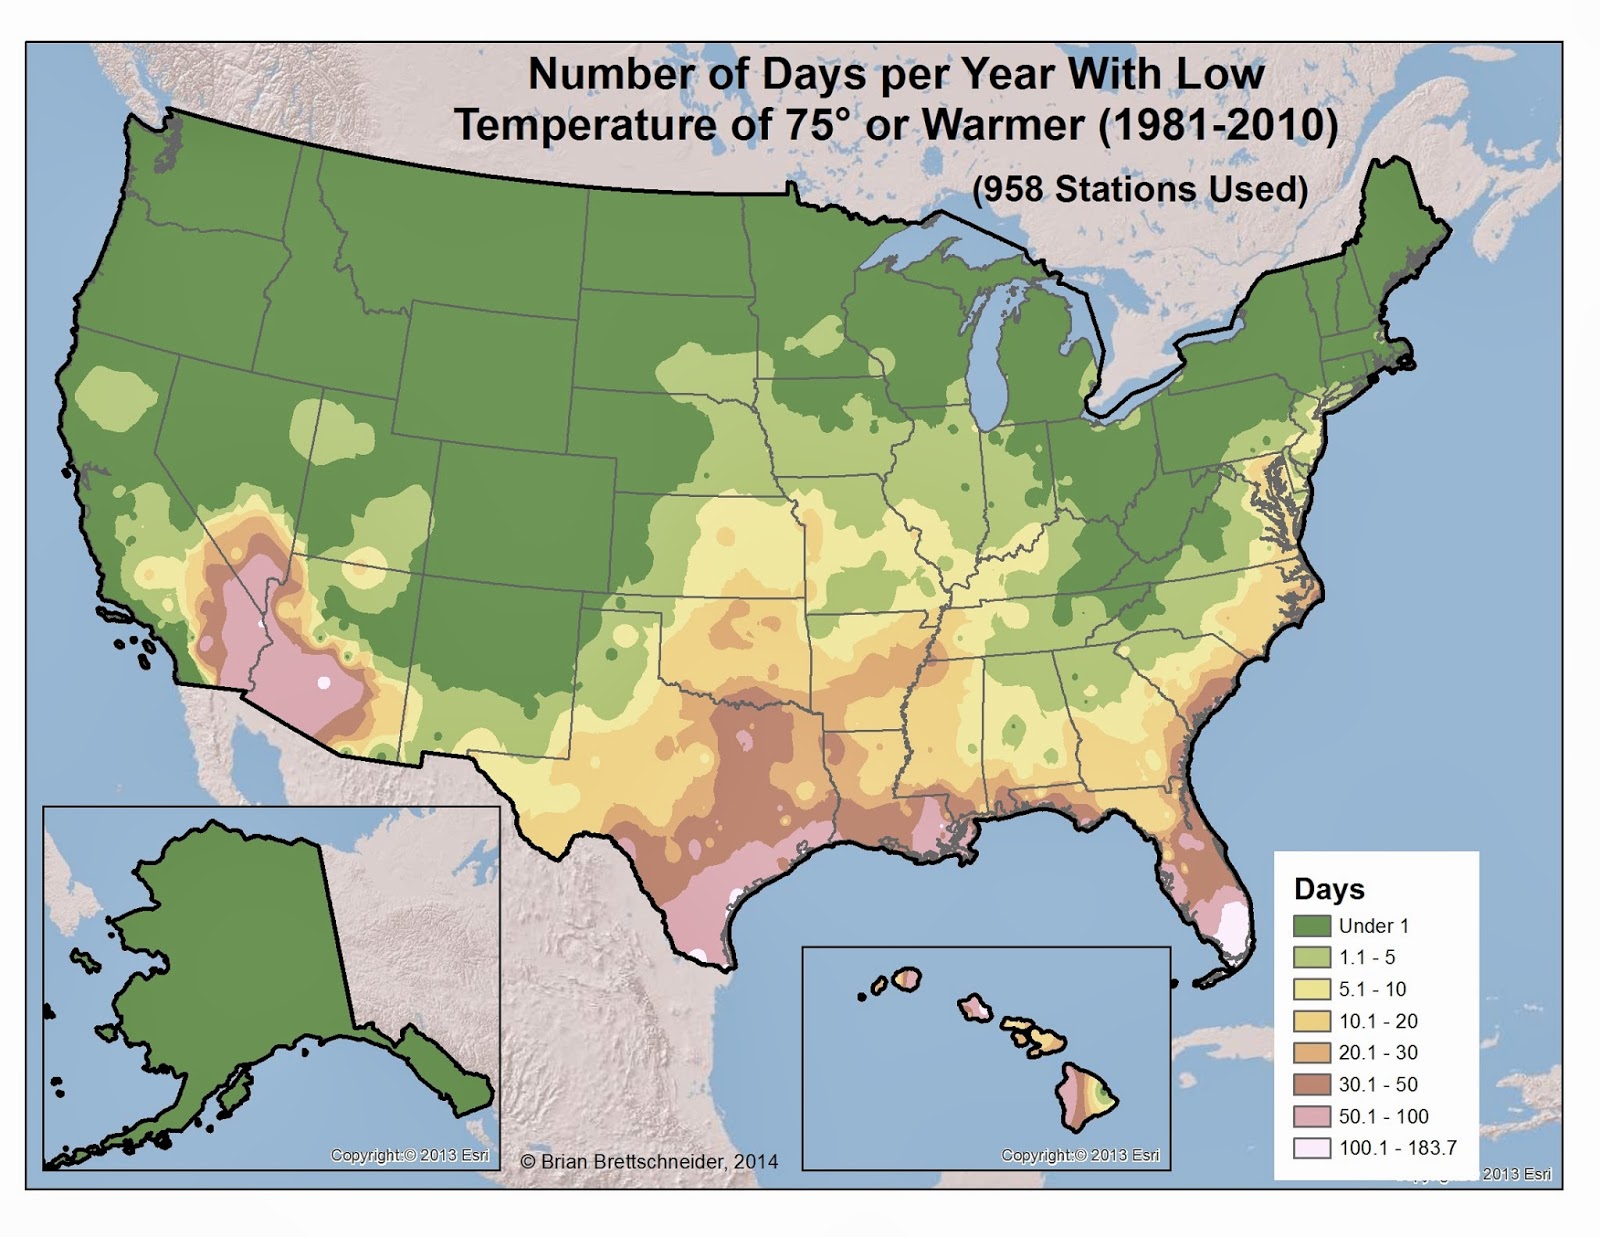
On the flip side, a low of 75°F or warmer seemed like a good cutoff to define an uncomfortably warm low temperature. The Gulf Coast was the 'winner' by this standard.
On the flip side, a low of 75°F or warmer seemed like a good cutoff to define an uncomfortably warm low temperature. The Gulf Coast was the 'winner' by this standard.
Figure 1. Average number of days each year with a high temperature between 70°F and 79°F. Stations bust have at least 10 complete year's of data between 1981 and 2010 to be included in the analysis.
Figure 2. Average number of days each year with a low temperature of 75°F or warmer. Stations bust have at least 10 complete year's of data between 1981 and 2010 to be included in the analysis.
Seasonal Midpoints
For some places, the transition from the cold of winter to the heat of summer is fairly quick. For others, it is a long, drawn out process. Here are three maps that graphically show the annual temperature low and high points, and the time between those two.
The first map shows the date where the normal (1981-2010) temperature reaches its lowest value in winter. If it spans more than one day they middle day is used. The second map shows the same information except for summer. The final maps shows the length of time (in days) between the coldest time of the year and the warmest.
Periodic Thermal Waves
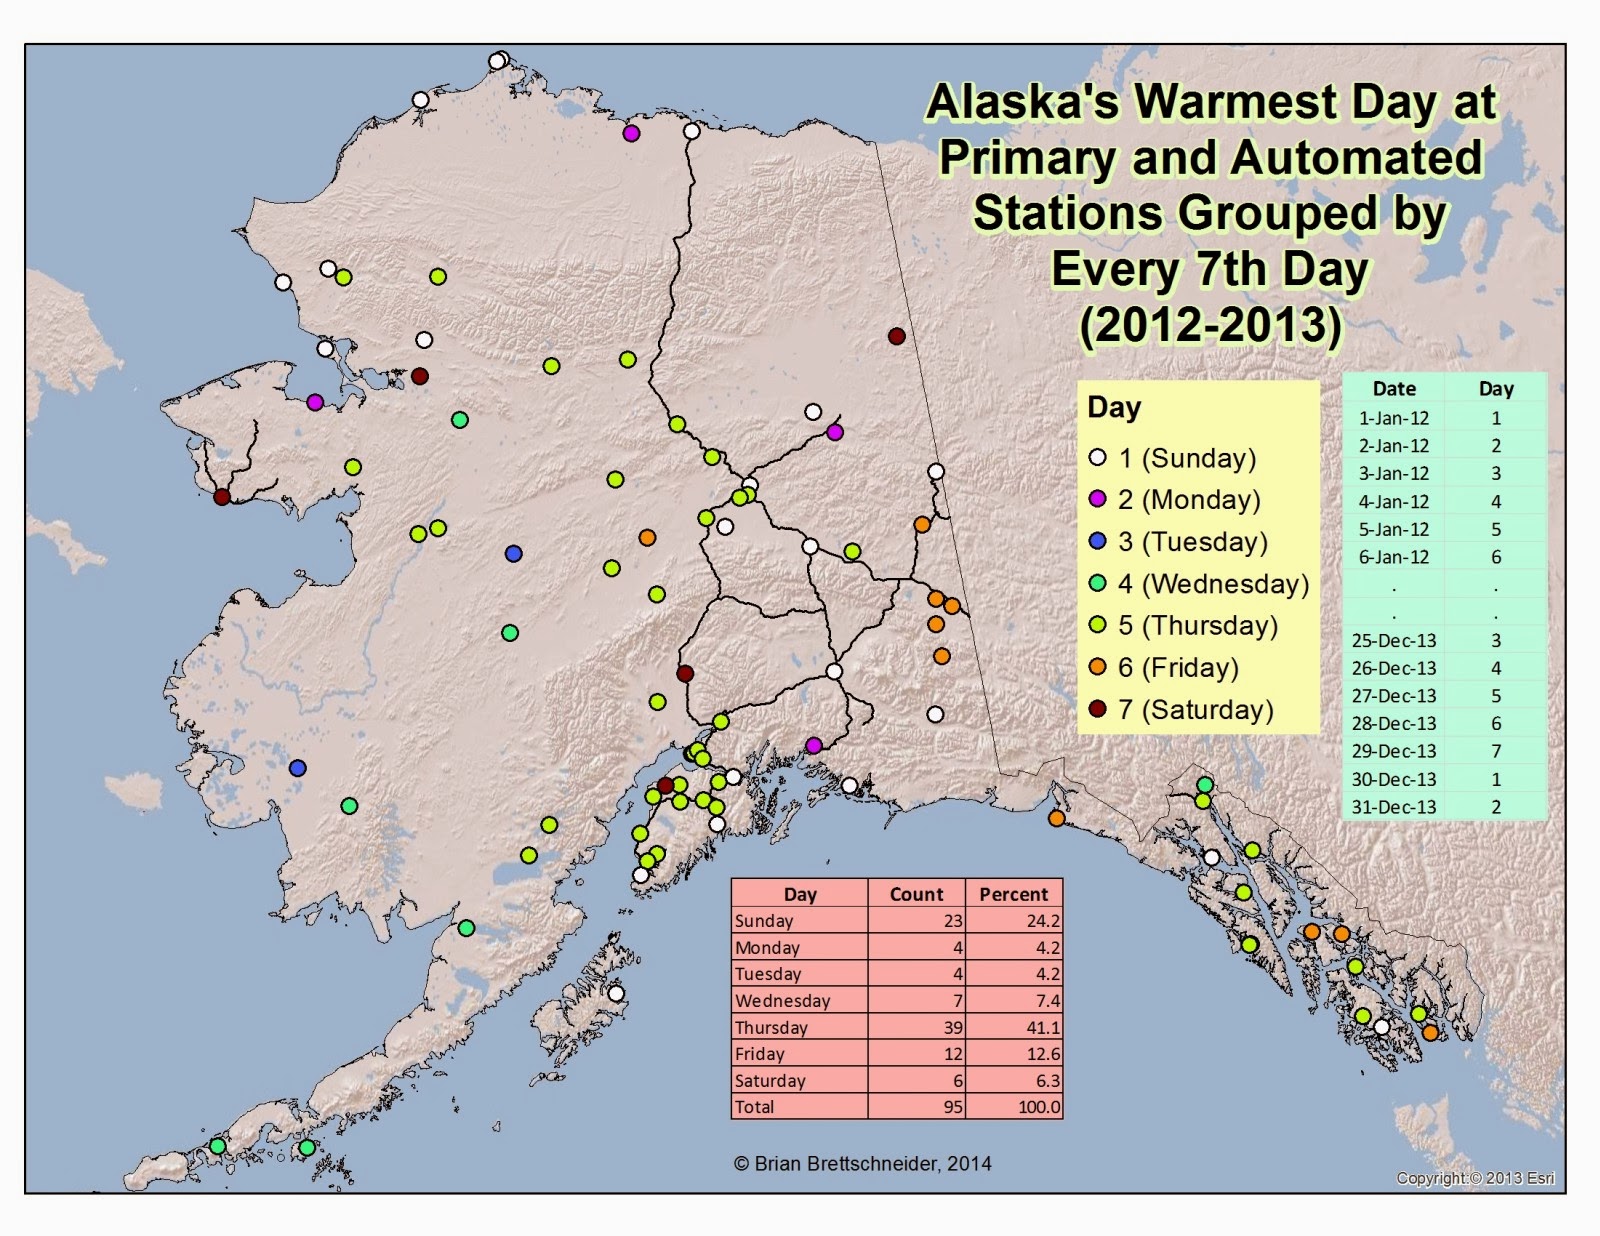
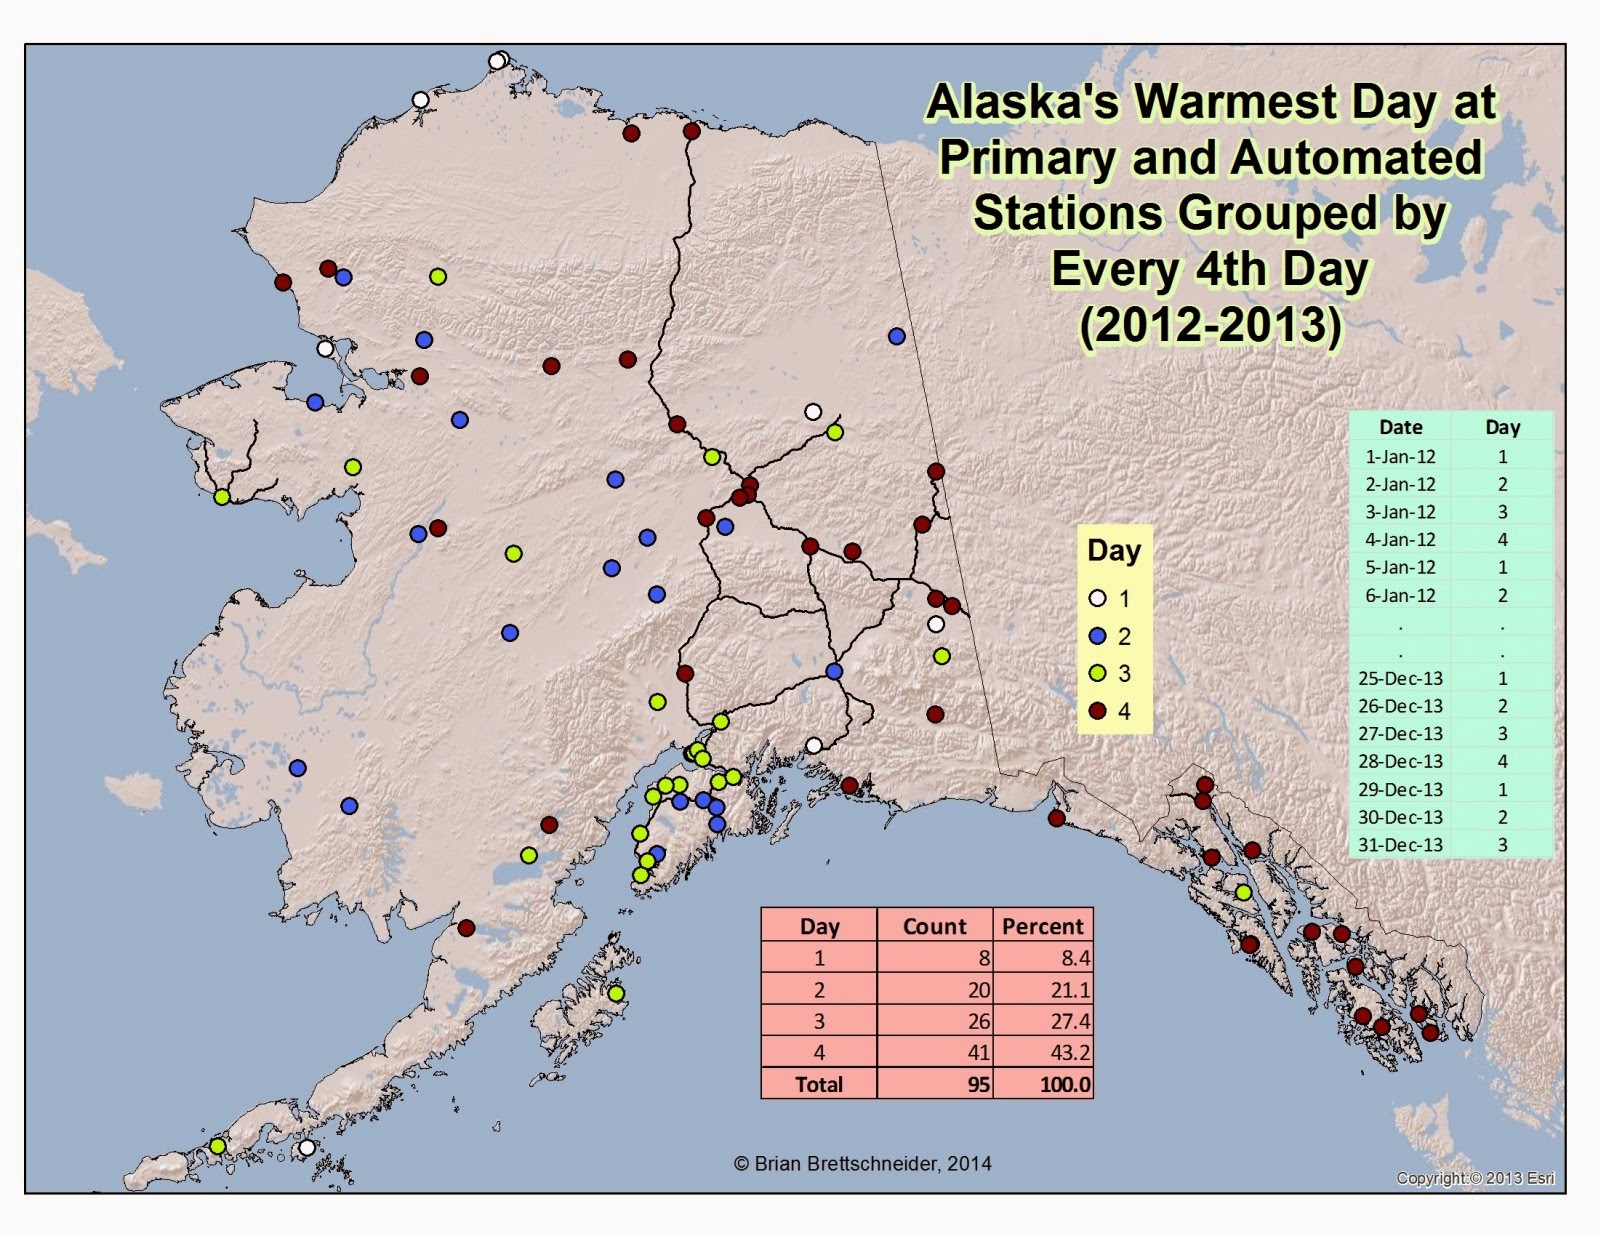
I thought it would be interesting to see what would happen when calculating what day of the week was the warmest in the U.S. It was intended to be a silly exercise to demonstrate that even if one day was the highest it would be statistically trivial. I looked at 'primary' stations only since my poor computer could only handle two years at once before crashing. So I queried 2012 and 2013. Well, much to my surprise, there were very distinct patterns. Not only were the patterns geographical, but the were temporal and propagated from west to east. Figure 1 shows the warmest days of the week for all primary stations in the U.S. Across areas with minimal longitudinal variation, the daily percentages are staggeringly variable. In Alaska for example (see Figure 2), an amazing 41% of stations were warmest on Thursday and only 4% are warmest on Tuesday or Wednesday. To me, that is a signal indicating a possible climate connection.
Fig 1. All primary stations in the U.S. mapped according to which day of the week during 2012 and 2013 was the warmest (1=Sunday, 2 = Monday, and so on.) Only stations with 95% complete data were used.
Fig 2. All primary and RAWS stations in Alaska mapped according to which day of the week during 2012 and 2013 was the warmest (1=Sunday, 2 = Monday, and so on.). Only stations with 90% complete data were used.
Fig 6. Day 2 of the 4-day thermal wave as depicted by the ESRL daily composite reanalysis. A wave axis is superimposed as a red line. This is a compilation of all Day 2s minus the average of Days 1, 3, and 4. 728 days were used in the analysis.
Fig 7. Day 3 of the 4-day thermal wave as depicted by the ESRL daily composite reanalysis. A wave axis is superimposed as a red line. This is a compilation of all Day 3s minus the average of Days 1, 2, and 4. 728 days were used in the analysis.
* Update section
After reading a section from a paper from 1976 (Blackmon, M. L. 1976. A climatological spectral study of the 500 mb geopotential height of the Northern Hemisphere. J. Atmos. Sci. 33, 1607 -1623.) that describes the propagation period of Rossby waves as 20° longitude per day, I decided to make reanalysis plots of the 500 mb height anomalies. The 20° value corresponds to 1/4 of the width of the Lower 48 states. Therefore, the 4-day thermal wave may be entirely explained by that.The wave train of anomalies stands out very nicely and clearly propagate from west to east.
I then set out to check time periods other than seven days. Of course a seven day period corresponds very nicely with a calendar week. I checked time periods between 2 and 30 days. For the 30-day period think of it as grouping Jan 1, Feb 1, March 1, etc. and calling those "Group 1". Then take Jan 2, Feb 2 March 2, etc. and call those "Group 2".
After a little trial and error, it was pretty obvious that 4-days was a very prominent pattern for the Lower 48 and modestly prominent for Alaska. Figure 3 shows which of the repeating 4 days is the warmest for the Lower 48 and Figure 4 shows the same but for Alaska.
Fig 3. All primary stations in the U.S. mapped according to which day, of a repeating 4-day pattern, during 2012 and 2013 was the warmest. Only stations with 95% complete data were used.
Fig 4. All primary and RAWS stations in Alaska mapped according to which day, of a repeating 4-day pattern, during 2012 and 2013 was the warmest. Only stations with 90% complete data were used.
Looking at the ESRL Reanalysis data (see Figures 5, 6, 7, and 8 below), a very clearly defined 4-day thermal wave is evident. I compared each of the four repeating days with the other days in the 4-day set to track the atmospheric patterns for 2012 and 2013. I am quite amazed that given the number of days used in the analysis (728) that any pattern whatsoever holds up. If the 4-day pattern was 3.5 or 4.5 days it would break down in the reanalysis data after a while. When I ran the same analysis at the 7-day interval (not shown) a noticeable, but less prominent thermal wave was also evident. I can share those images with anyone who may be interested.
So what recurs at 4 and 7 days. One obvious answer is planetary (Rossby) waves. They tend to recur at 7-day intervals according to the literature but their period is pretty variable and is highly dependent on the number of waves. The fact that the 7-day pattern in Figure 1 is more prominent between 40°N and 50°N lends credence to the planetary wave origin for that length time period. But what about the 4-day pattern? It has a much stronger signal. Is it related to planetary waves? What drives the thermal push depicted in Figures 5-8? Also, might the 7-day pattern actually be a 1/2 strength version of the 4-day pattern since 7 is almost, but not exactly, a multiple of 4?
Surely this is not a new discovery. My brief search of the literature didn't lead to any obvious answers beyond the Rossby wave solution. Any ideas would be much appreciated.
Fig 5. Day 1 of the 4-day thermal wave as depicted by the ESRL daily composite reanalysis. A wave axis is superimposed as a red line. This is a compilation of all Day 1s minus the average of Days 2, 3, and 4. 728 days were used in the analysis.
Fig 8. Day 4 of the 4-day thermal wave as depicted by the ESRL daily composite reanalysis. A wave axis is superimposed as a red line. This is a compilation of all Day 4s minus the average of Days 1, 2, and 3. 728 days were used in the analysis.
* Update section
After reading a section from a paper from 1976 (Blackmon, M. L. 1976. A climatological spectral study of the 500 mb geopotential height of the Northern Hemisphere. J. Atmos. Sci. 33, 1607 -1623.) that describes the propagation period of Rossby waves as 20° longitude per day, I decided to make reanalysis plots of the 500 mb height anomalies. The 20° value corresponds to 1/4 of the width of the Lower 48 states. Therefore, the 4-day thermal wave may be entirely explained by that.The wave train of anomalies stands out very nicely and clearly propagate from west to east.
Fig 9. 500mb height anomaly on Day 1 of the 4-day thermal wave as depicted by the ESRL daily composite reanalysis. This is a compilation of all Day 1s minus the average of Days 2, 3, and 4. 728 days were used in the analysis.
Fig 10. 500mb height anomaly on Day 2 of the 4-day thermal wave as depicted by the ESRL daily composite reanalysis. This is a compilation of all Day 2s minus the average of Days 1, 3, and 4. 728 days were used in the analysis.
Fig 11. 500mb height anomaly on Day 3 of the 4-day thermal wave as depicted by the ESRL daily composite reanalysis. This is a compilation of all Day 3s minus the average of Days 1, 2, and 4. 728 days were used in the analysis.
Fig 12. 500mb height anomaly on Day 4 of the 4-day thermal wave as depicted by the ESRL daily composite reanalysis. This is a compilation of all Day 4s minus the average of Days 1, 2, and 3. 728 days were used in the analysis.
Subscribe to:
Posts (Atom)


