** Note: this is the Alaska-centered version of this blog post. For the Contiguous U.S.-centered version, click
HERE. **
"
Today's high temperature will be in the 60°s." - unknown
Official, unofficial, anecdotal, and other communication mediums frequently discuss temperature forecasts in terms of 10-degree Fahrenheit temperature ranges. While greater precision in forecasts is always available, using these broad temperature categories is fairly useful.
Looking at longer time-scales, these types of temperature categories are especially useful. Me might say, for example, that Dallas, Texas, is
typically in the 90°s during the month of June. This gives a meaningful description of the early-summer climate at that location without confusing it with an actual forecast. If we expand upon the brief example for Dallas, Texas, it might be useful to ask ourselves how common are days in the 90°s at Dallas and at other places across he U.S. Why stop with 90°s? What about 80°s, or 50°s, or 20°s?.
Methodology
To find the answer to this question, we need to look at high temperature data for as many stations across the U.S. as possible. The National Climate Data Center (NCDC) maintains an archive of daily climate data for thousands of stations across the U.S. as part of the Global Historical Climatology Network (GHCN) database.
For this analysis, I placed three restrictions on the data. 1) only data since 1981 were utilized, 2) stations must have 10+ complete years of data, and 3) only WBAN (first-order) stations were used.
The first criteria allows us to closely mirror the current 1981-2010 climate normal period employed by the NCDC. The second criteria just makes sure enough data to draw meaningful conclusions. The third criteria has to do with the processing power and memory limitations of my computer.
Using the aforementioned selection criteria, a total of 985 stations contained sufficient data for inclusion. A map of those stations is shown in Figure 1.
Figure 1. All WBAN stations with at least 10 years of complete high-temperature data since 1981.
10-Degree Category Maps
The following section contains 12 maps each representing the number of days per year with a high temperature in a 10°F range. For example, how many days have a high temperature in the 90°s? This query would include all days with a high temperature greater than or equal to 90°F and less than or equal to 99°F. The first and last maps represent categories greater than 10°F; e.g., days with a high temperature less than 0°F, and days with a high temperature greater than or equal to 100°F. Please note that no attempt was made to account for elevation in mountainous areas.
Figure 2. Number of days per year with a high temperature below 0°F.
Figure 3. Number of days per year with a high temperature in the +0°s (0°F to 9°F).
Figure 4. Number of days per year with a high temperature in the 10°s (10°F to 19°F).
Figure 5. Number of days per year with a high temperature in the 20°s (20°F to 29°F).
Figure 6. Number of days per year with a high temperature in the 30°s (30°F to 39°F).
Figure 7. Number of days per year with a high temperature in the 40°s (40°F to 49°F).
Figure 8. Number of days per year with a high temperature in the 50°s (50°F to 59°F).
Figure 9. Number of days per year with a high temperature in the 60°s (60°F to 69°F).
Figure 10. Number of days per year with a high temperature in the 70°s (70°F to 79°F).
Figure 11. Number of days per year with a high temperature in the 80°s (80°F to 89°F).
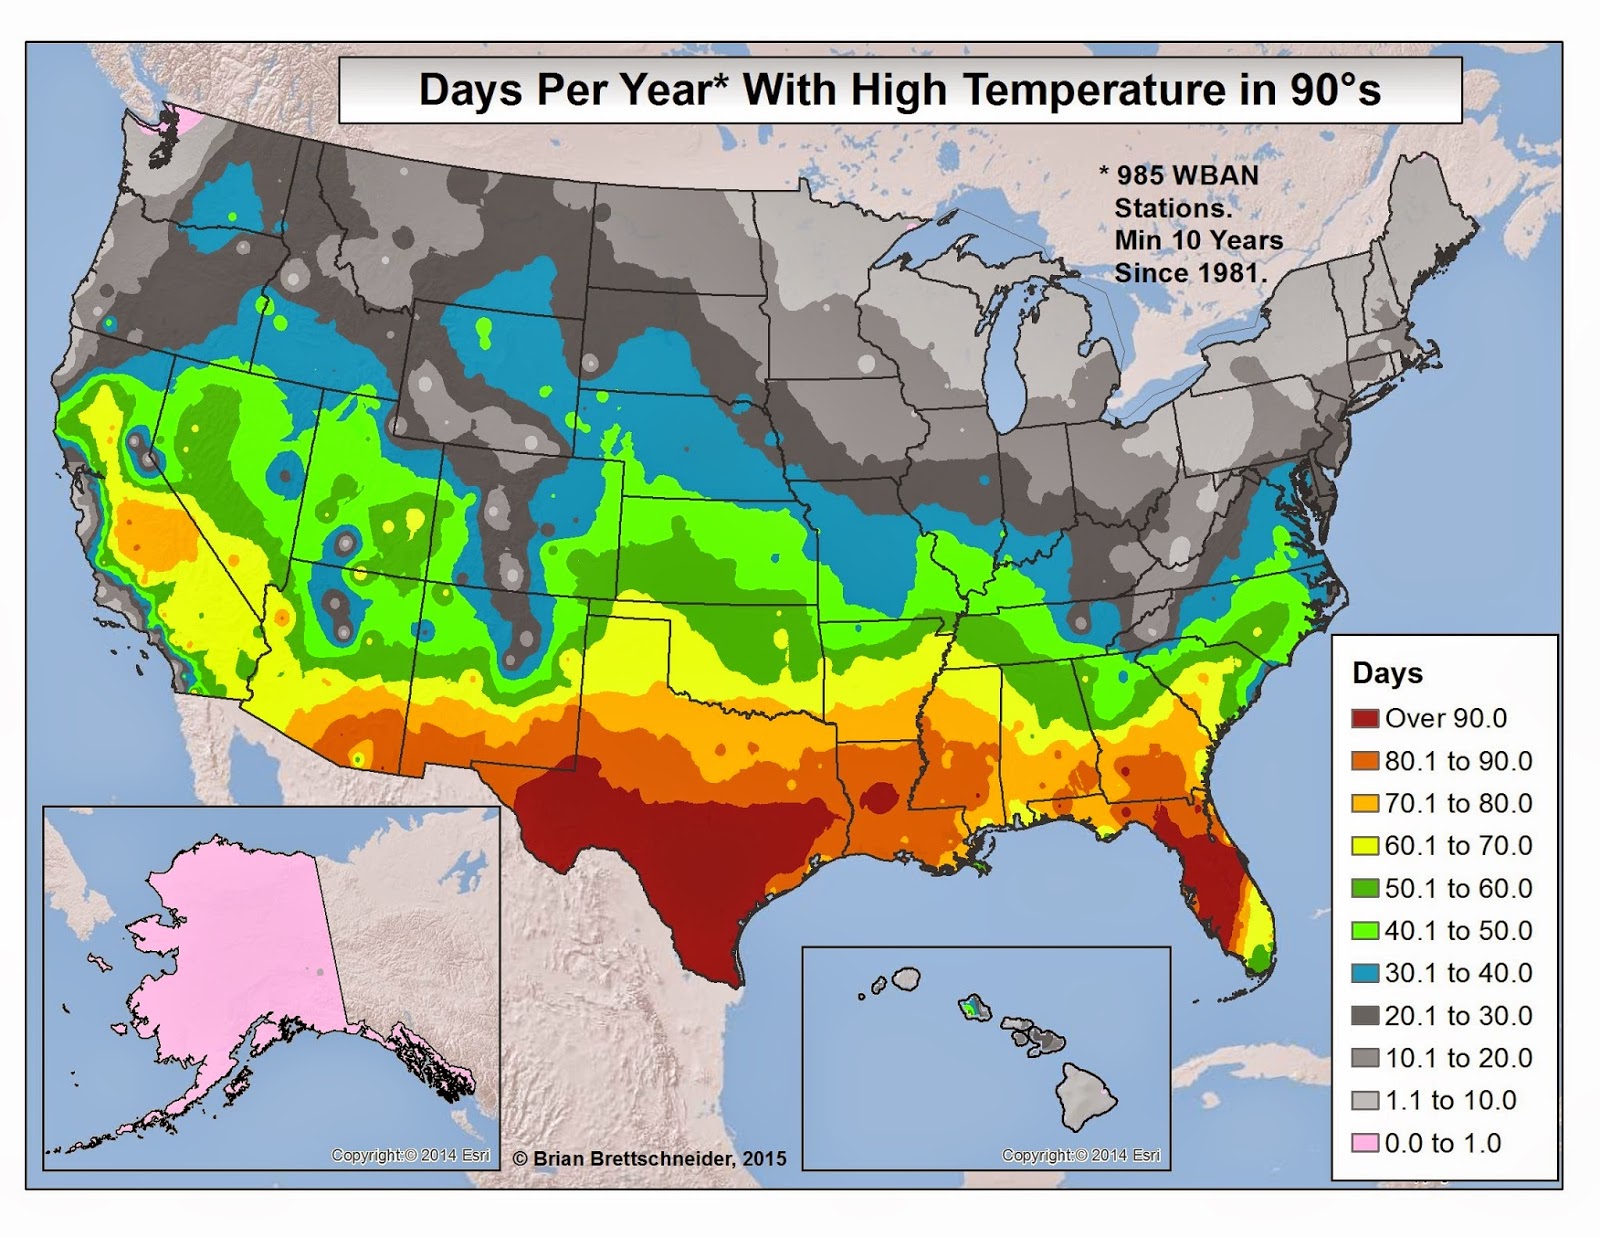
Figure 12. Number of days per year with a high temperature in the 90°s (90°F to 99°F).
Figure 13. Number of days per year with a high temperature 100°F or above.
Figure 14. Most common 10° high temperature group.