Every six months or so I take a look at the social media presence of the 118 National Weather Service forecast office (not including San Juan, Guam, and American Samoa). The previous analysis of both the Facebook and Twitter followers is located here (
http://us-climate.blogspot.com/2015/03/nws-social.html ). Please note that the three Alaska NWS Office share a single Facebook page, yet have separate Twitter pages. In lieu of a complete replication of the March 28th post, I want to show a snapshot of where things stand as of now.
A note of caution. While rankings are labeled on the maps, and while it is human nature to make comparisons, keep in mind that the needs and demographics of each WFO are different.
Facebook:
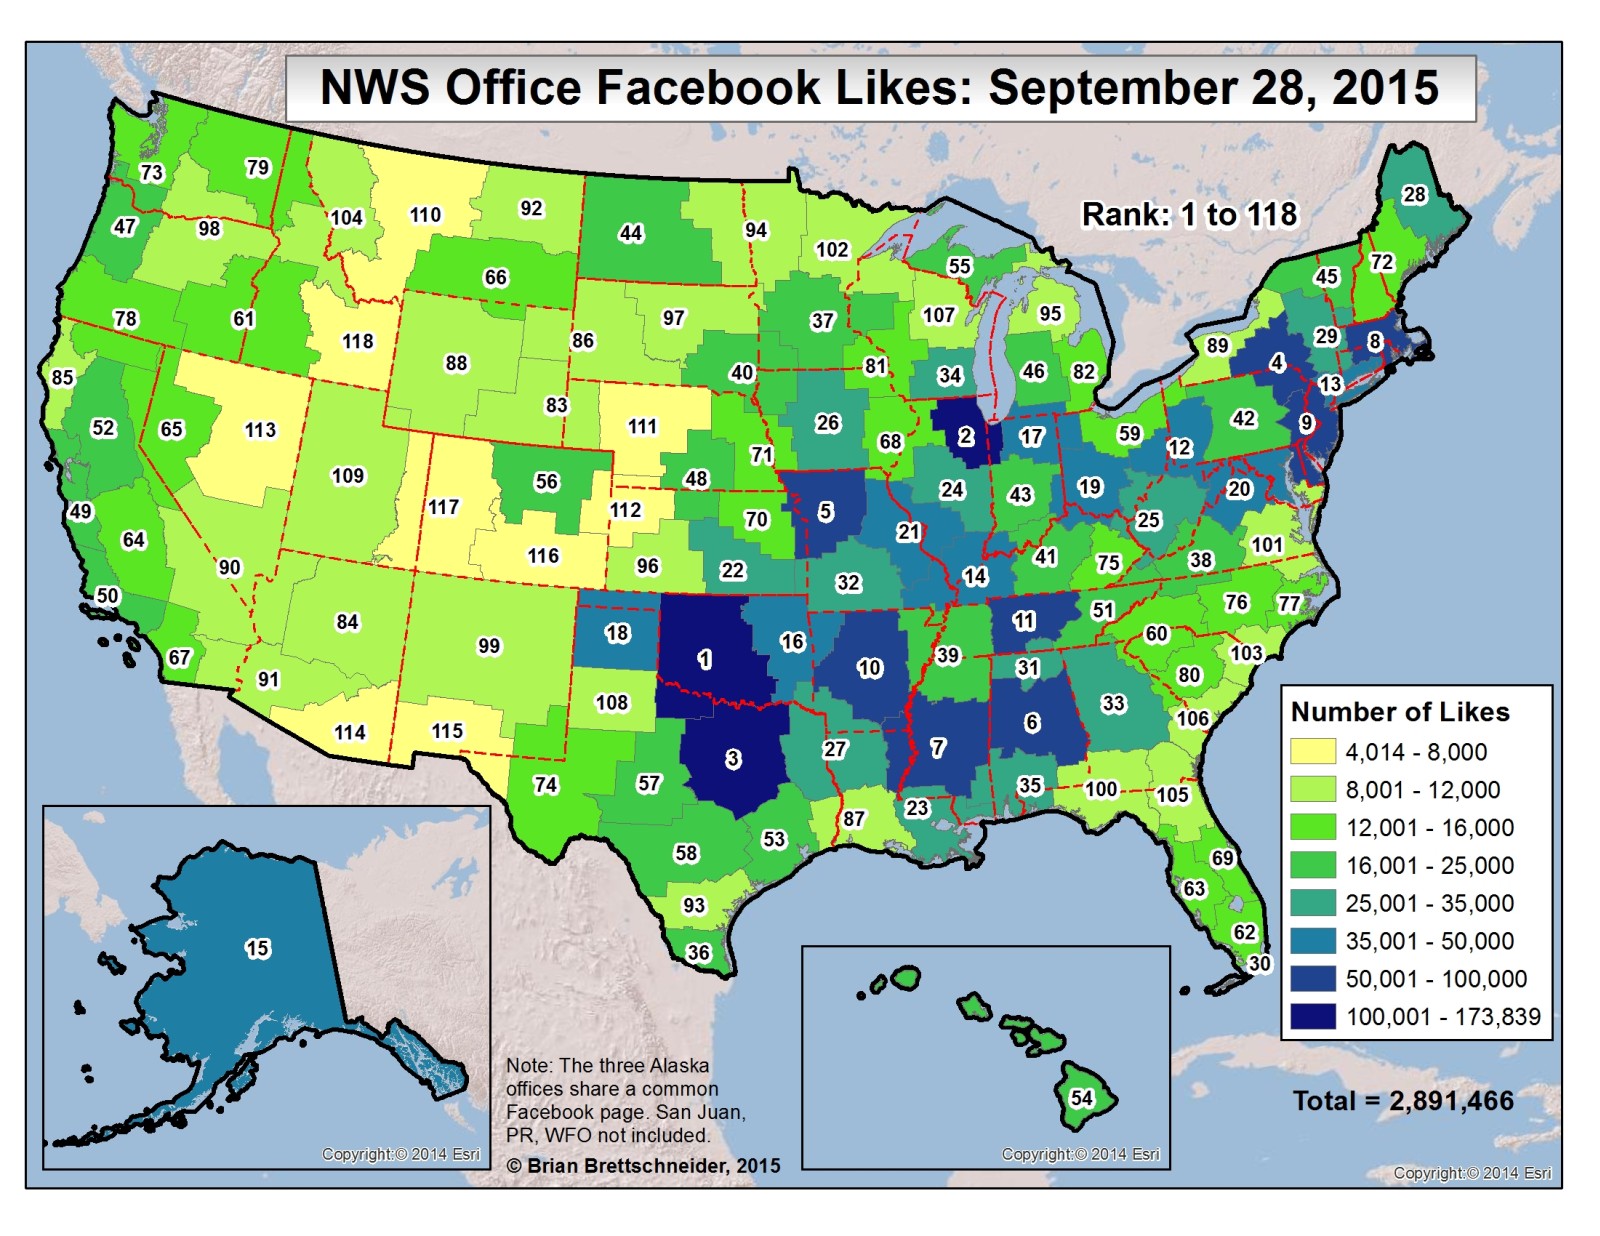
The three Facebook maps below show the raw number of Likes (Figure 1), the rate of Likes per 100,000 population (Figure 2), and the change in Likes over the last six months (Figure 3).
Figure 1. Facebook Likes for 118 National Weather Service forecast offices as of September 28, 2015. Rank label (highest to lowest) added to each WFO.
Figure 2. Facebook Likes per 100,000 population for 118 National Weather Service forecast offices as of September 28, 2015. Rank label (highest to lowest) added to each WFO.
Figure 3. Rate of change of Facebook Likes for 118 National Weather Service between March 28, 2015, and September 28, 2015. Percent change labelled for each WFO.
Twitter
Twitter functions quite a bit differently than Facebook. While Facebook is a more casual source of information, Twitter is much more like a news aggregation site. The information is short, sweet, and timely. My experience has been that Twitter is much more of a specialized type of social media where the participants are in the media, celebrities, actors, athletes, and subject matter specialists.
So, here are my two maps for Twitter. The first (Figure 4, shows the number of Twitter followers for each NWS page. The second show the average number of Tweets sent out by those offices since their Twitter account was activated (Figure 5).
Figure 4. Twitter followers for 120 National Weather Service forecast offices as of September 28, 2015. Rank label (highest to lowest) added to each WFO. (Alaska offices separated out).
Figure 5. Twitter followers per 100,000 population for 120 National Weather Service forecast offices as of September 28, 2015. Rank label (highest to lowest) added to each WFO. (Alaska offices separated out).
Figure 6. Number of Tweets per month sent by the 118 National Weather Service forecast offices as of September 28, 2015. Rank label (highest to lowest) added to each WFO. Value computed by dividing number of tweets by number of months since page's inception. (Alaska offices combined).
Table 1. Raw count of Facebook Likes, Twitter Followers, Tweets, and rate of Tweets by National Weather Service Forecast Office (WFO). Separate entries made for the Alaska WFOs so that Twitter statistics are identifiable. They share identical Facebook values.
| WFO | FB Likes | Twitter Followers | Total Tweets | Tweets / Month |
|---|
| Aberdeen | 9,463 | 3,425 | 2,285 | 58.0 |
| Albany | 28,481 | 5,789 | 5,438 | 141.6 |
| Albuquerque | 9,165 | 5,279 | 11,200 | 258.3 |
| Amarillo | 39,288 | 7,792 | 3,984 | 101.2 |
| Anchorage | 43,699* | 4,951 | 2,501 | 65.8 |
| Austin/San Antonio | 16,336 | 10,300 | 8,812 | 218.1 |
| Baltimore/Washington | 38,992 | 10,700 | 4,705 | 133.0 |
| Billings | 14,186 | 3,464 | 4,207 | 104.1 |
| Binghamton | 85,197 | 7,283 | 9,264 | 254.8 |
| Birmingham | 78,009 | 17,100 | 12,000 | 297.0 |
| Bismarck | 20,592 | 3,312 | 4,601 | 113.9 |
| Blacksburg | 22,607 | 5,785 | 8,358 | 223.6 |
| Boise | 15,107 | 3,918 | 2,752 | 77.8 |
| Boston | 72,275 | 32,700 | 17,200 | 447.9 |
| Brownsville | 23,898 | 4,147 | 6,063 | 150.1 |
| Buffalo | 10,694 | 7,841 | 1,900 | 56.9 |
| Burlington | 20,503 | 5,827 | 6,228 | 162.2 |
| Caribou | 28,668 | 2,421 | 8,889 | 274.8 |
| Charleston (SC) | 8,401 | 10,200 | 9,228 | 176.0 |
| Charleston (WV) | 29,944 | 5,118 | 1,871 | 47.5 |
| Cheyenne | 11,719 | 2,924 | 4,455 | 113.1 |
| Chicago | 112,556 | 20,800 | 11,400 | 296.9 |
| Cleveland | 15,679 | 5,954 | 2,655 | 67.4 |
| Columbia | 12,292 | 3,848 | 5,199 | 109.7 |
| Corpus Christi | 10,188 | 4,535 | 3,763 | 93.1 |
| Dallas/Fort Worth | 102,441 | 39,000 | 12,800 | 316.8 |
| Davenport/Quad Cities | 13,380 | 4,816 | 3,289 | 83.5 |
| Denver/Boulder | 16,615 | 11,400 | 6,047 | 153.5 |
| Des Moines | 29,778 | 9,979 | 7,981 | 202.6 |
| Detroit/Pontiac | 12,259 | 6,026 | 3,273 | 83.1 |
| Dodge City | 9,820 | 4,291 | 6,904 | 170.9 |
| Duluth | 8,838 | 2,204 | 2,594 | 75.5 |
| El Paso | 5,971 | 4,317 | 9,264 | 213.6 |
| Elko | 6,943 | 2,285 | 7,386 | 182.8 |
| Eureka | 11,549 | 3,051 | 5,909 | 146.2 |
| Fairbanks | 43,699* | 2,600 | 1,967 | 51.8 |
| Flagstaff | 11,660 | 6,286 | 4,175 | 103.3 |
| Gaylord | 9,822 | 2,808 | 9,675 | 245.6 |
| Glasgow | 10,538 | 2,507 | 2,097 | 51.9 |
| Goodland | 7,509 | 3,446 | 6,866 | 174.3 |
| Grand Forks | 10,075 | 3,124 | 3,334 | 84.6 |
| Grand Junction | 5,631 | 2,249 | 5,073 | 143.4 |
| Grand Rapids | 19,710 | 5,550 | 3,772 | 95.8 |
| Gray/Portland | 13,048 | 4,679 | 6,611 | 172.2 |
| Great Falls | 7,913 | 3,458 | 9,199 | 227.7 |
| Green Bay | 8,392 | 3,916 | 2,409 | 59.6 |
| Greenville-Spartanburg | 15,602 | 4,995 | 5,253 | 133.4 |
| Hastings | 19,210 | 4,365 | 7,453 | 189.2 |
| Honolulu | 17,248 | 8,050 | 1,722 | 32.8 |
| Houston/Galveston | 18,024 | 11,400 | 6,037 | 153.3 |
| Huntsville | 27,619 | 10,900 | 4,687 | 116.0 |
| Indianapolis | 20,747 | 14,900 | 8,245 | 209.3 |
| Jackson (KY) | 12,760 | 3,855 | 7,853 | 199.4 |
| Jackson (MS) | 75,295 | 13,200 | 14,400 | 356.4 |
| Jacksonville | 8,456 | 4,052 | 4,787 | 118.5 |
| Juneau | 43,699* | 2,109 | 7,627 | 200.7 |
| Kansas City/Pleasant Hill | 82,302 | 24,100 | 9,481 | 180.8 |
| Key West | 28,081 | 7,863 | 4,226 | 104.6 |
| La Crosse | 12,270 | 4,006 | 6,022 | 152.9 |
| Lake Charles | 11,115 | 3,338 | 5,264 | 130.3 |
| Las Vegas | 10,593 | 8,844 | 9,026 | 223.4 |
| Lincoln | 30,948 | 6,647 | 4,746 | 120.5 |
| Los Angeles/Oxnard | 18,945 | 15,800 | 8,195 | 208.1 |
| Louisville | 21,372 | 8,868 | 8,821 | 224.0 |
| Lubbock | 8,155 | 5,680 | 5,272 | 130.5 |
| Marquette | 16,743 | 4,003 | 3,722 | 92.1 |
| Medford | 12,430 | 2,739 | 1,427 | 35.3 |
| Melbourne | 13,314 | 5,086 | 4,148 | 102.7 |
| Memphis | 22,413 | 9,820 | 9,628 | 238.3 |
| Miami | 15,069 | 13,300 | 8,395 | 207.8 |
| Midland/Odessa | 12,836 | 3,416 | 8,470 | 209.6 |
| Milwaukee/Sullivan | 25,652 | 5,169 | 4,797 | 121.8 |
| Minneapolis/Twin Cities | 23,455 | 15,400 | 10,300 | 261.5 |
| Missoula | 8,757 | 3,586 | 9,657 | 239.0 |
| Mobile/Pensacola | 25,052 | 14,400 | 12,200 | 301.9 |
| Morristown/Knoxville | 18,615 | 3,874 | 3,198 | 79.1 |
| Mount Holly/Philadelphia | 67,482 | 17,300 | 2,637 | 67.0 |
| Nashville | 55,707 | 13,600 | 14,200 | 360.5 |
| New Orleans/Baton Rouge | 32,068 | 7,587 | 6,010 | 148.7 |
| New York | 46,268 | 24,600 | 8,252 | 209.5 |
| Newport/Morehead City | 12,505 | 2,941 | 5,538 | 152.3 |
| Norman/Oklahoma City | 173,839 | 53,000 | 14,200 | 390.5 |
| North Little Rock | 64,215 | 19,100 | 2,861 | 70.8 |
| North Platte | 7,658 | 3,677 | 7,308 | 185.5 |
| Northern Indiana | 40,180 | 10,100 | 11,200 | 284.4 |
| Omaha/Valley | 13,283 | 8,778 | 4,701 | 119.4 |
| Paducah | 44,807 | 10,100 | 8,107 | 205.8 |
| Peachtree City/Atlanta | 26,782 | 10,300 | 4,377 | 108.3 |
| Pendleton | 9,201 | 2,461 | 2,052 | 52.1 |
| Phoenix | 10,567 | 10,500 | 6,978 | 172.7 |
| Pittsburgh | 48,433 | 13,500 | 5,404 | 144.6 |
| Pocatello | 4,014 | 2,465 | 9,095 | 225.1 |
| Portland | 19,633 | 6,893 | 5,465 | 142.3 |
| Pueblo | 5,939 | 3,805 | 5,377 | 133.1 |
| Raleigh | 12,545 | 7,873 | 3,471 | 92.9 |
| Rapid City | 11,519 | 3,452 | 1,306 | 33.2 |
| Reno | 14,657 | 4,833 | 5,024 | 124.3 |
| Riverton | 10,841 | 2,004 | 7,613 | 193.3 |
| Sacramento | 18,599 | 10,200 | 11,900 | 302.1 |
| Salt Lake City | 8,052 | 10,200 | 10,400 | 257.4 |
| San Angelo | 16,336 | 4,636 | 5,234 | 129.5 |
| San Diego | 13,427 | 6,355 | 12,500 | 288.3 |
| San Francisco Bay Area/Monterey | 18,989 | 17,100 | 16,800 | 426.5 |
| San Joaquin Valley/Hanford | 14,739 | 4,204 | 11,500 | 284.6 |
| Seattle | 12,839 | 7,670 | 2,812 | 73.2 |
| Shreveport | 29,533 | 4,069 | 11,500 | 292.0 |
| Sioux Falls | 21,464 | 10,300 | 7,619 | 188.6 |
| Spokane | 12,318 | 4,618 | 5,673 | 70.6 |
| Springfield | 27,260 | 8,964 | 4,706 | 119.5 |
| St. Louis | 36,715 | 8,564 | 3,002 | 74.3 |
| State College | 20,811 | 5,744 | 8,544 | 216.9 |
| Tallahassee | 8,964 | 6,782 | 6,249 | 154.7 |
| Tampa | 14,837 | 7,810 | 12,800 | 316.8 |
| Topeka | 13,285 | 7,880 | 4,356 | 107.8 |
| Tucson | 6,378 | 5,493 | 6,606 | 163.5 |
| Tulsa | 41,225 | 11,100 | 7,171 | 139.5 |
| Wakefield | 8,864 | 2,531 | 635 | 21.6 |
| Wichita | 33,731 | 14,000 | 7,561 | 192.0 |
| Wilmington (NC) | 8,780 | 5,200 | 2,116 | 59.8 |
| Wilmington (OH) | 39,268 | 11,500 | 5,548 | 140.9 |