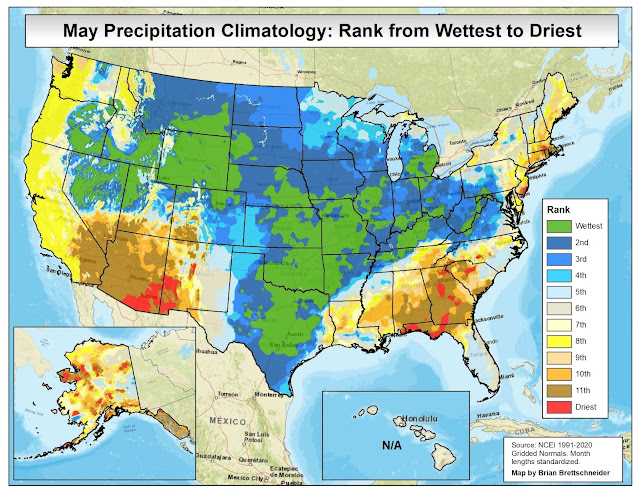
Using the 1991-2020 gridded climate normals, here are the ranking from wettest to driest of each of the 12 months of the year.
IMPORTANT NOTE: I standardized the length of each month for an apples-to-apples comparison. For example, if February averages 3.00" of precipitation and March averages 3.05" of precipitation, February will have a higher rank since their precipitation fell on fewer days. It is functionally a ranking of average daily precipitation. Also, Hawai'i was not included in this data set, so their data is not shown on the maps.


