In our daily lives we experience weather from one day to the next but we also have an expectation of the weather for certain times of the year. This expectation is a our sense of the local climate. For example, someone living in Chicago, IL, knows that temperatures will not reach 70°F in the middle of January; however, their experience tells them that 70°F high temperatures are possible in April, May, and September. On this level, we all have an sense of the climate for the place we live based on our life experiences.
Köppen Climate Classification system:
From a scientific perspective, it is convenient to develop guidelines for describing the climate that are consistent and comparable. The most famous of all climate classification systems is the Köppen Climate Classification system. The Köppen Climate Classification system (http://en.wikipedia.org/wiki/Köppen_climate_classification ) was developed in 1884 by Wladimir Köppen and subsequently refined by others. The beauty of the Köppen system is that the categories are solely based on temperature and precipitation. The distinction between categories is determined by the magnitude and the seasonal distribution of those categories.
Köppen broadly grouped regions into 5 categories using letter designations. They are:
Tropical (A) – temperature of coolest month 18°C (64.4°F) or higher.
Desert (B) – complicated criteria based on precipitation. This category supersedes all others.
Mesothermal (C) – temperature of warmest month greater than or equal to 10°C (50°F), and temperature of coldest month less than 18°C (64.4°F) but greater than -3°C (26.6°F).
Microthermal (D) – temperature of warmest month greater than or equal to 10°C (50°F), and temperature of coldest month -3°C (26.6°F) or lower.
Polar (E) – temperature of warmest month less than 10°C (50°F).
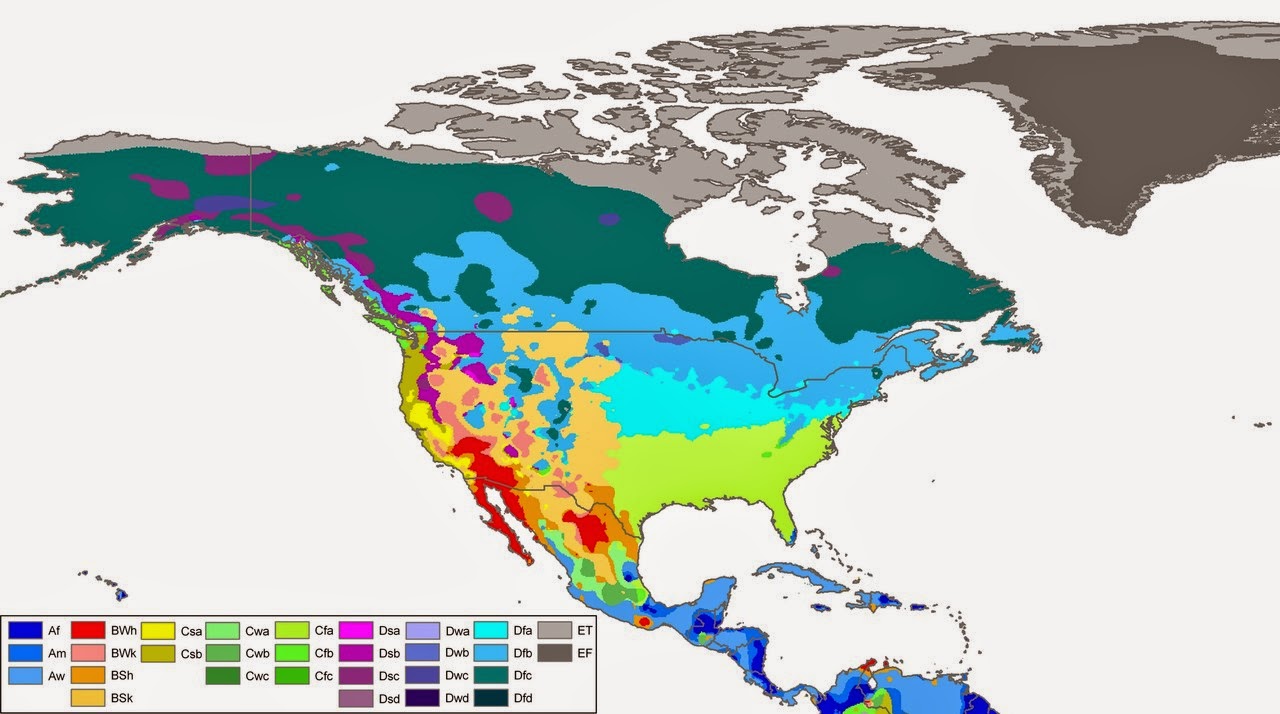
Each of these major groupings can be subdivided into sub-groupings based on finer-scale temperature and precipitation data. A great description of the criteria for each major and sub-grouping can be found here: http://www.britannica.com/EBchecked/topic/322068/Koppen-climate-classification . The map below is from Wikipedia and shows the major and minor groupings for ll of North America. The legend uses the A through E major groupings and each major grouping has different color shades representing the minor groupings.
Figure 1. Köppen Climate Classification map of North America from Wikipedia. Categories were derviced from 1951-2000 data obtained from GHCN v.2.
New Climate Data:
The National Center for Environmental Information (NCEI) archives temperature and precipitation for thousands of stations across the globe – not just the U.S. The Köppen Climate Classification system utilizes monthly data for bot temperature and precipitation. The data utilized for this exercise are the Global Historical Climatology Network (GHCN) version 2 precipitation data and the version 4 temperature data. Oddly, temperature and precipitation are stored in separate files. The stations in the two data sets have slightly different coordinates, identification numbers, periods of record, and even station names. This makes the linkage between the two data sets (temperature and precipitation) unusually difficult.
My solution was the start with the temperature data set. All stations that had at least 20 complete years of temperature data between 1981 and 2010 were used. The total number of valid temperature stations was 9,419. Next, I identified all precipitation stations with at least 20 complete years between 1951 and 2010. I expanded the range of years under the assumption that monthly precipitation does not change enough over long periods of time to reflect a changing climate. Since most of the precipitation criteria involve the relationship between wet and dry season, the total precipitation is not overly important. Also, limiting the range of years to 1981-2010 produced too few matches. The total number of precipitation stations was 12.675 using the expanded criteria.
Now that the temperature and precipitation data sets were isolated, I needed to link them together. As noted earlier, the ID numbering system is completely different between the two data sets and no table exists to cross-reference the stations. In addition, the location precision is different between the two data sets so the dots on the map are not perfectly aligned. Therefore, I performed a spatial search. If a precipitation point was within 10 miles of a temperature point, the two records were combined. It's not a perfect arrangement, but it's the best I can do for now.
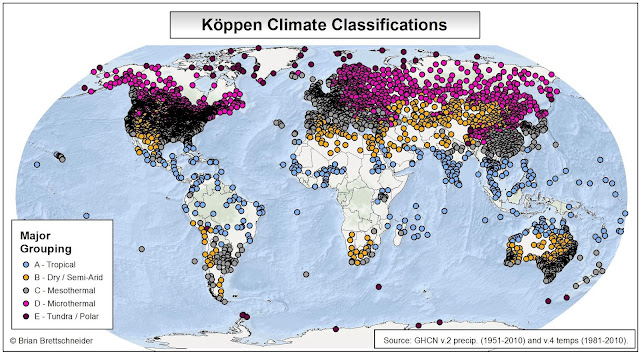
A total of 3,918 stations have monthly temperature and precipitation data in a suitable form for Köppen analysis. The next map (Figure 2) shows the major grouping for each of the 3,918 stations in the U.S. Unlike the map from Wikipedia, I decided to leave to data in point form.
Figure 2. Köppen Climate Classification major groupings based on GHCN climate data from NCEI. Click on map to see a larger version.
For large sections of the globe, homogeneity in the rule. However, since Desert (B) classifications supersede other classifications, the distinction between categories in the dry areas can be difficult to put a boundary around. When the map data is changed to show minor categories, this boundaries between categories are too complex to generalize with a choropleth map. The next map (Figure 3) shows all 3,918 stations with their Köppen Climate Classification minor groupings.
Google Earth:
While static maps are an excellent way to communicate spatial information, an even better method is to let uses browse the data for themselves. I put together a .kmz of the data for all 3,918 stations. This is a Google Earth file that can be opened by anyone with the Google Earth software installed on their computer. The file can be downloaded at the following location:
Once the file is downloaded and opened using Google Earth, the user can navigate to any station to see their classification type and all of their monthly normals from NCDC by clicking on the dot. The final map (Figure 4) shows a screenshot of the stations loaded into Google Earth. The station information for Madrid, Spain, is displayed in the figure.
Figure 4. Google Earth screenshot of the Köppen Climate Classification placemarks file.
*************************************
Here is the link to the Google Earth file with Köppen Climate Classifications for all 6,405 stations in the U.S. that have 1981-2010 climate normals. koppen.kmz


