Sunday, December 17, 2017

Christmas Climatology

The following is a list or random Christmas Climatology facts and figures. All data come from the GHCN-D database from NCEI.


A) No station outside of Hawaii has ever had a 10" rain event on Christmas Day. The Continental U.S. record is 9.84" at Dothan, AL, in 1964. LINK

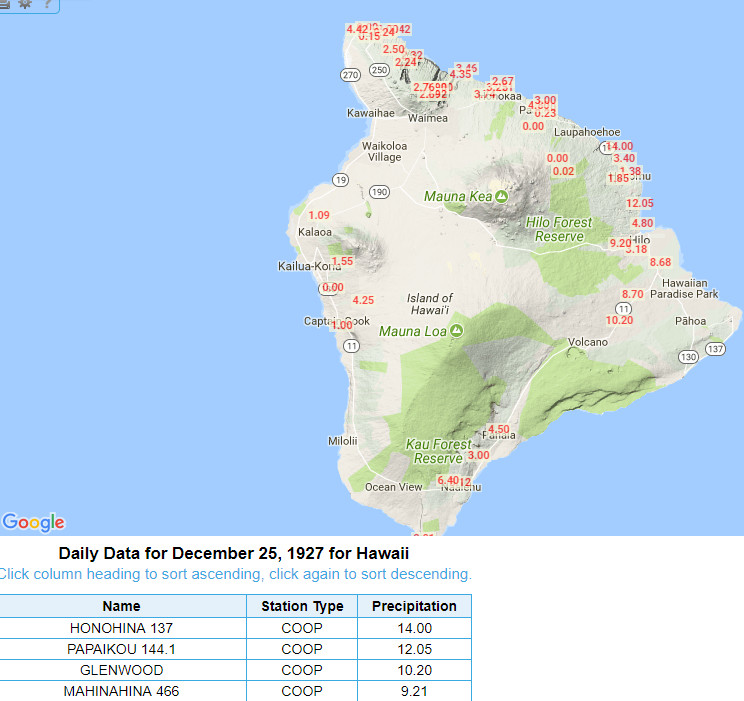
B) Hawaii has seen four 10" rainfalls on Christmas Day. Three in 1927 on the Big Island. LINK

C) The wettest Christmas *may be* 1975 and the driest *may be* 1999. LINK


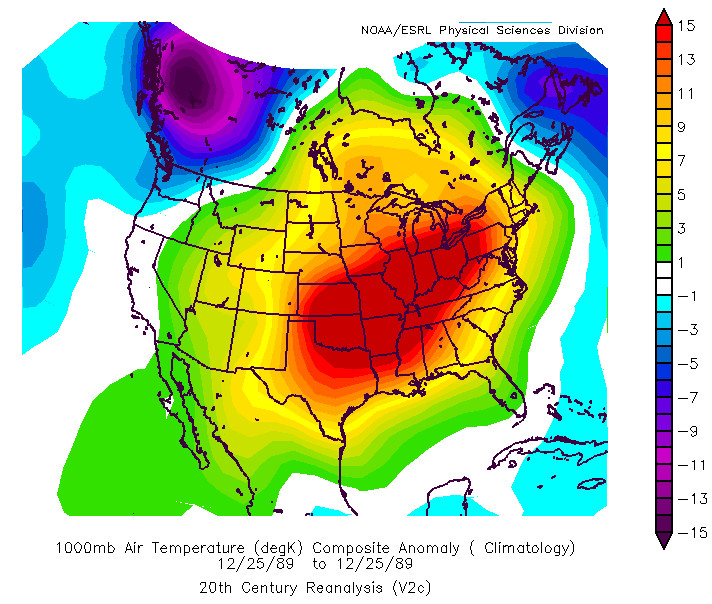
D) A closer look at the ESRL 20th Century Reanalysis data set (1851-2014) shows that Christmas 1889 was the warmest during that time period (also exceeding 2015). Note: this data set models temps using SLP, SST, and sea ice. LINK


E) The coldest Christmas is easily 1983. Christmas 1983 is not only the coldest Christmas Day on record. In the R1 Reanalysis database, Dec 25, 1983, is the second coldest of any day between Jan 1, 1948, and present [12/22/1989]. LINK1 LINK2


F) The coldest Christmas in Alaska was 1961.


G) The warmest Christmas in Alaska is a near tie between 1971 and 1985.


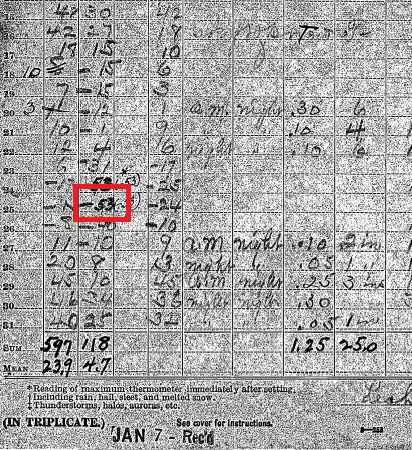
H) The lowest Christmas Day temperature in the Lower 48 was -53°F at Riverside, OR, in 1924. LINK 


I) La Pryor, TX, hit 93°F on Christmas Day 1955. That is the U.S. Christmas record. 

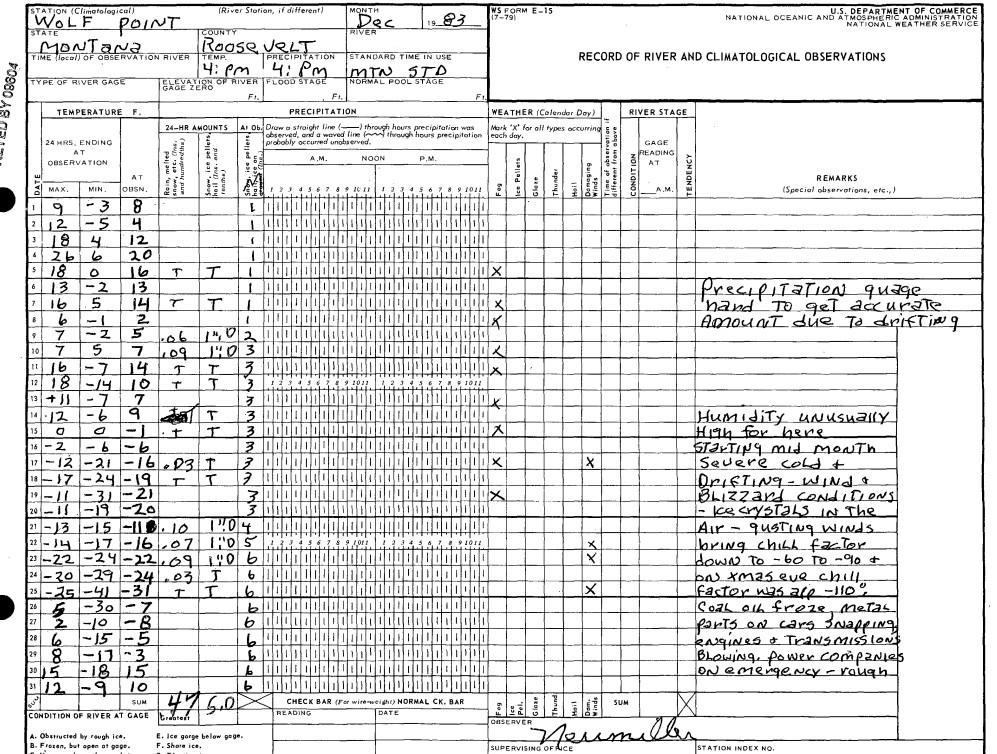
J) The lowest Christmas high temperature was -25°F at Wolf Point, MT, in 1983. LINK 


K) The lowest max (coldest high temperature) on an Alaska Christmas was -56°F. Allakaket (1917) and Eagle (1961) share the honor. LINK

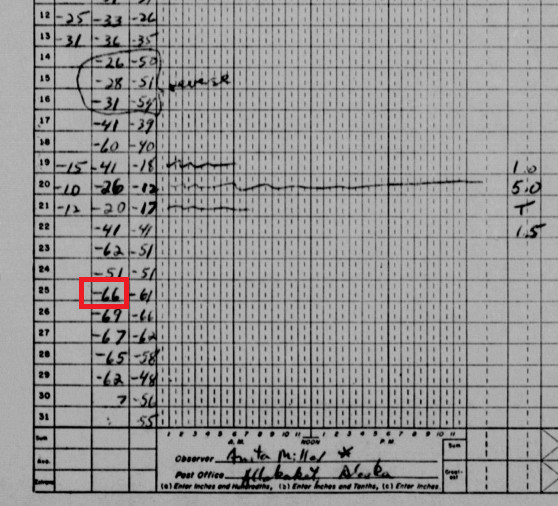
L) The lowest low temperature on Christmas Day in Alaska was a chilly -66°F at Allakaket in 1954. LINK 


M) The warmest Christmas Day temperature in Alaska was 57°F at Copper Center School in 1962. LINK 

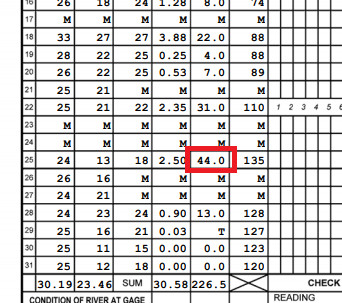
N) The greatest Christmas Day snow is 44.0" at the Mount Rainer Paradise Ranger Station in 2015. Note: This is possibly a three-day total. The next highest total is 40.2" at Portola, California, in 1971. LINK 


O) The deepest snow depth on Christmas Day is 160". Both Mt. Rainer Paradise Ranger Station (1996) and Mt. Baker Lodge (1948) achieved this value. LINK 

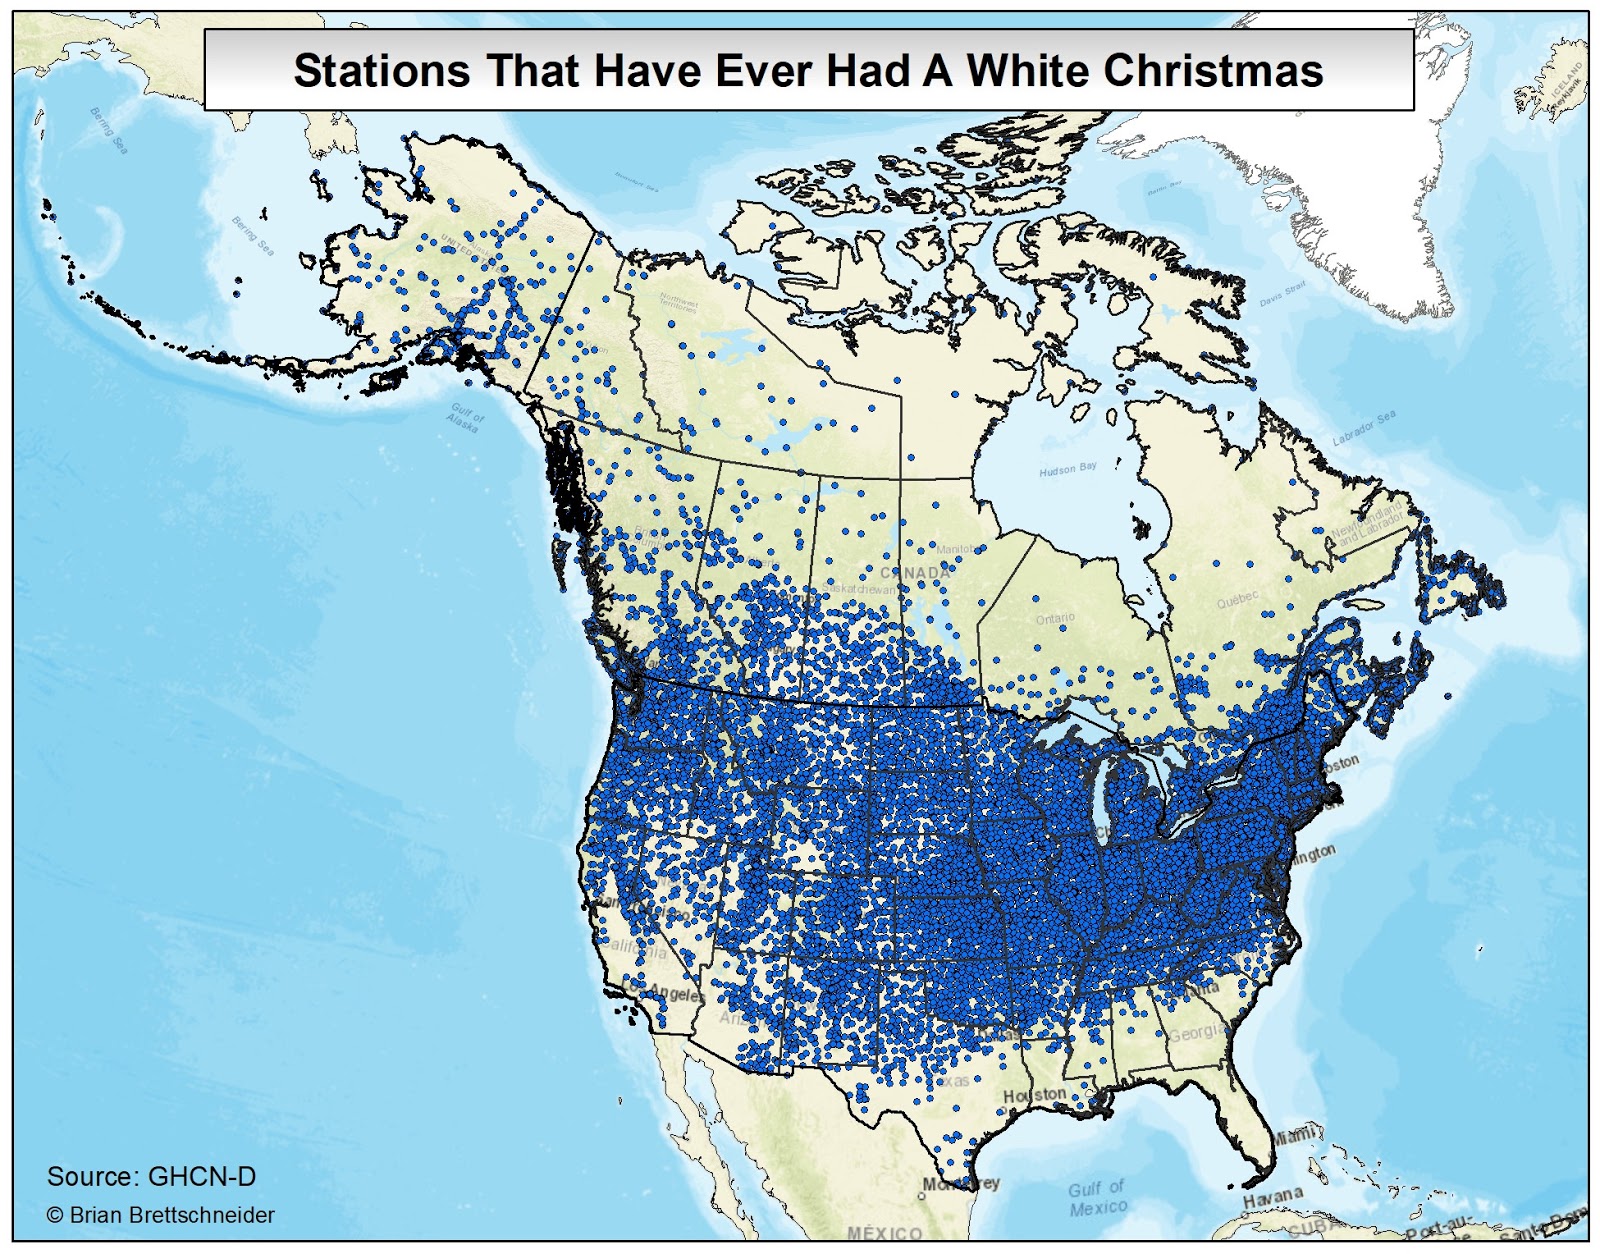
P) There are 4,469 stations with at least 50 years of Christmas Day temperature data. All but 21 (not incl Hawaii) have had at least one Christmas freeze. 7 in Florida, 13 in California, 1 in Louisiana. LINK

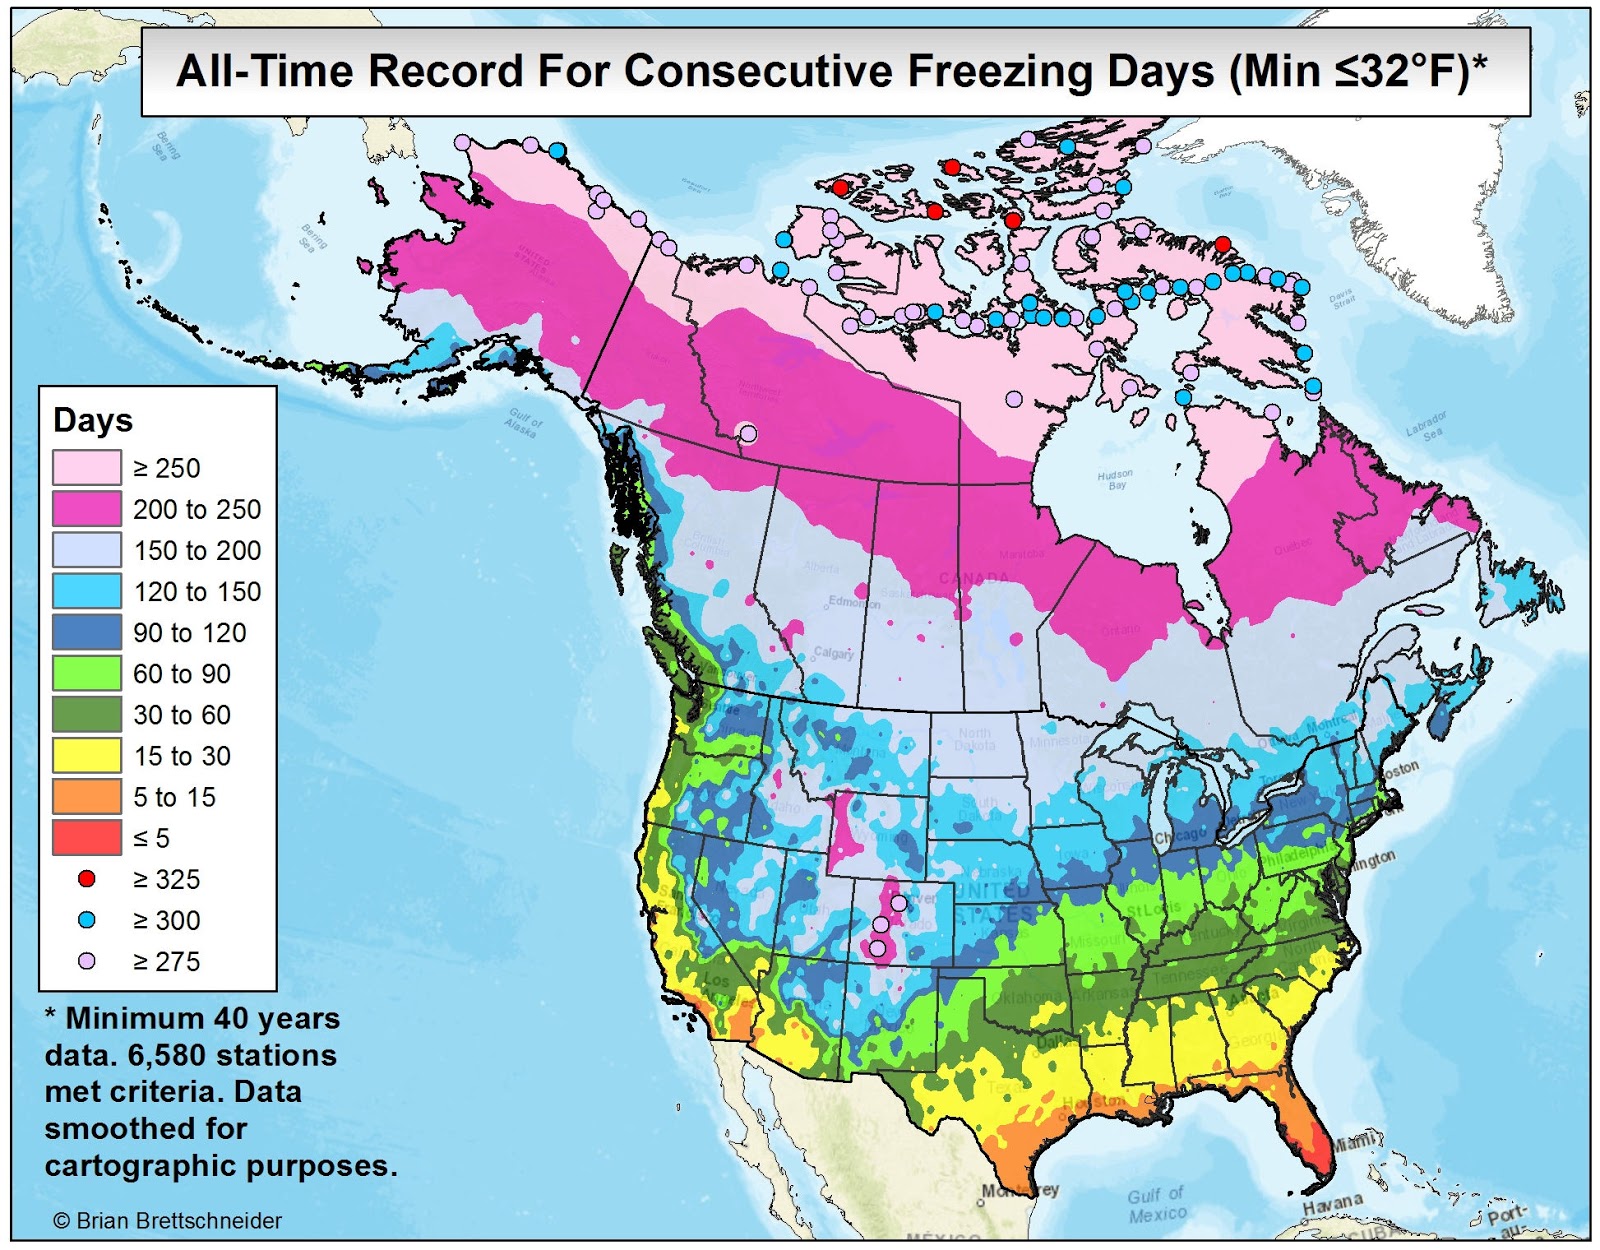
Q) Utqiaġvik (Barrow), Bettles, Northway, Tok, Kotzebue, Ft. Yukon, and Tanana, Alaska, have never had a Christmas Day temperature above freezing. [min 50 years]. LINK 

R) In Alaska, Tok (5°F), Northway (9°F), and Ft. Yukon (9°F) have never had a Christmas low temp warmer than 10°F. [min 50 years] LINK

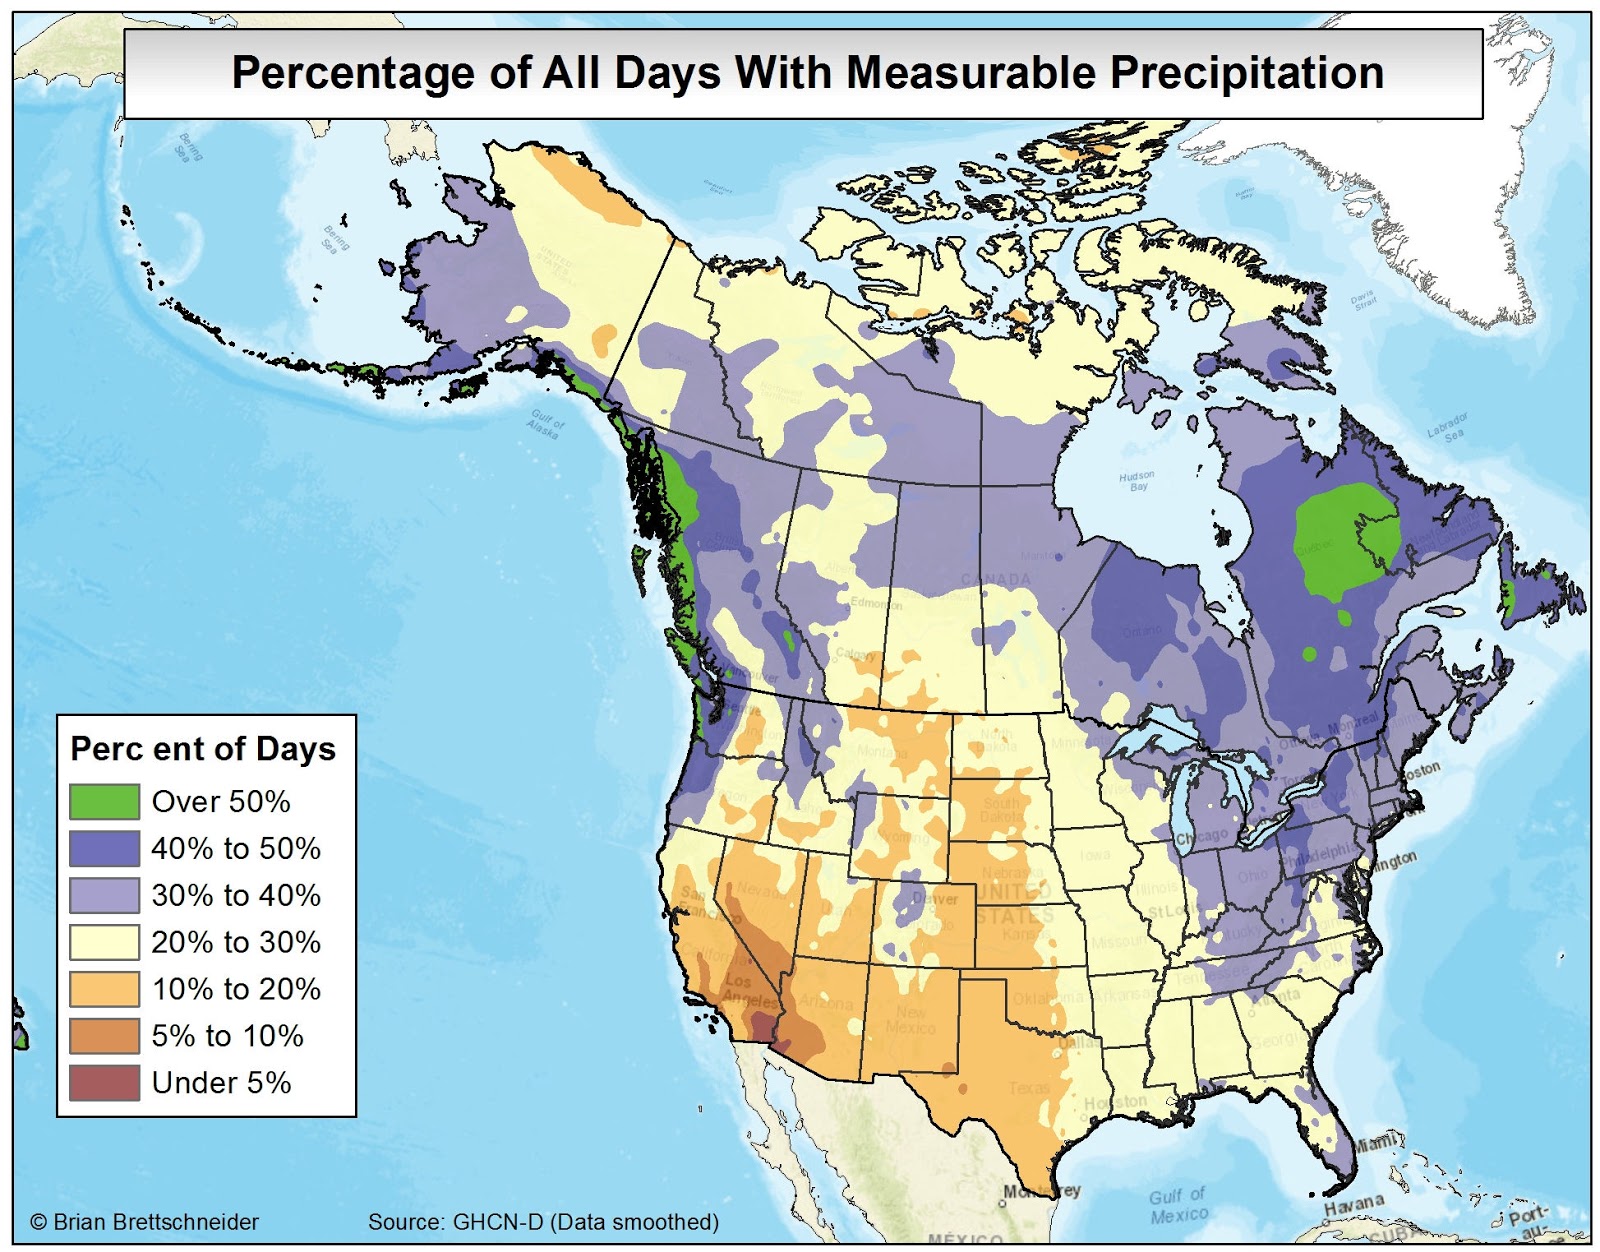
S) In 1919, only 2.6% of stations in the Lower 48 had measurable precipitation on Christmas Day. In 1940, 48.0% of stations had measurable precipitation. LINK

T) There are seven station that have not recorded measurable precipitation on Christmas Day [min 50 years]. LINK

U) The Otis 2 NE Cooperative station in Oregon has recorded measurable precipitation on 53 of 65 Christmas Days. That is the highest percentage outside of Hawaii. LINK. They also have the longest current streak of Christmas' with measurable precipitation. 23 in a row and counting. Outside the Pacific NW, only Bradford, PA, has had 20 consecutive Christmas' with measurable precip (1961-1980). LINK

V) The Houghton Lake AP, Michigan, station once received measurable snow on 17 consecutive Christmas Days (1964-1980). LINK 

W) Map showing the record lowest Christmas Day temperature for stations with 40+ years of data. LINK


X) Map showing the warmest Christmas Day temperature on record using stations with at least 40 years of data. LINK


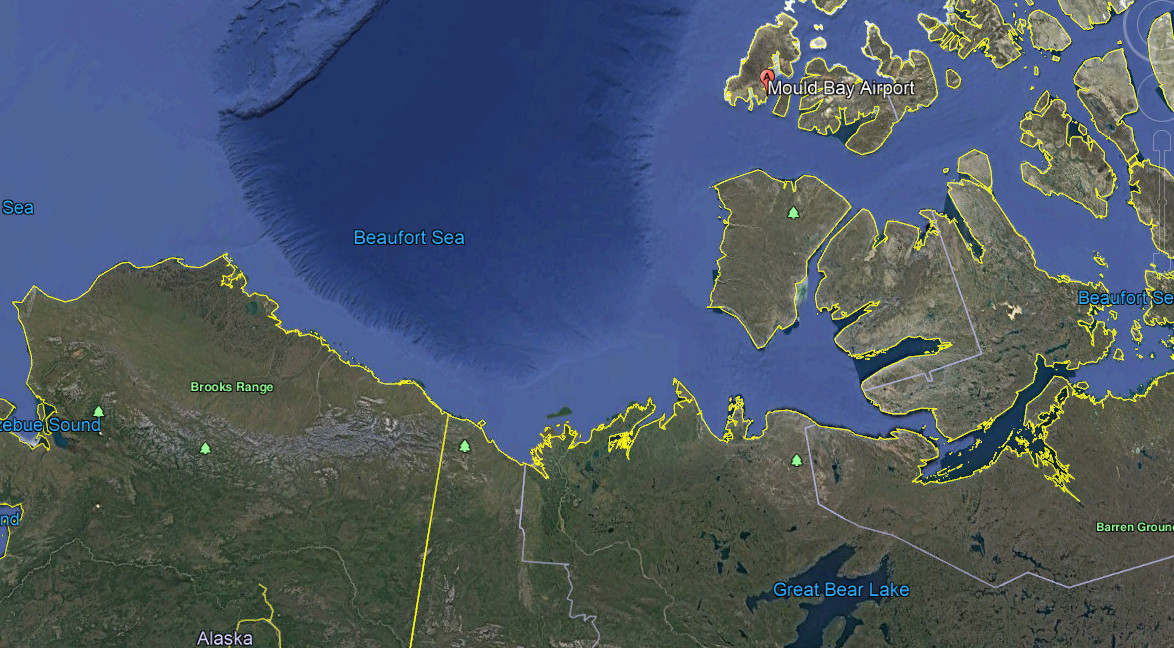
Y) Mould Bay, Canada, has Christmas Day data for 64 years. They have never recorded a Christmas temperature above 0°F.


Z) U.S. Stations with 10+ consecutive White Christmases overlaid on historical probability. Flagstaff, AZ, is a near certainty to end their run of 11 straight White Christmases. Doesn't look good for Wolf Canyon, NM, either. Every other dot looks safe. LINK 


AA) Coldest Christmas on record based on Reanalysis data: 1851-present. Note: pre-1948 methodology is less robust. LINK


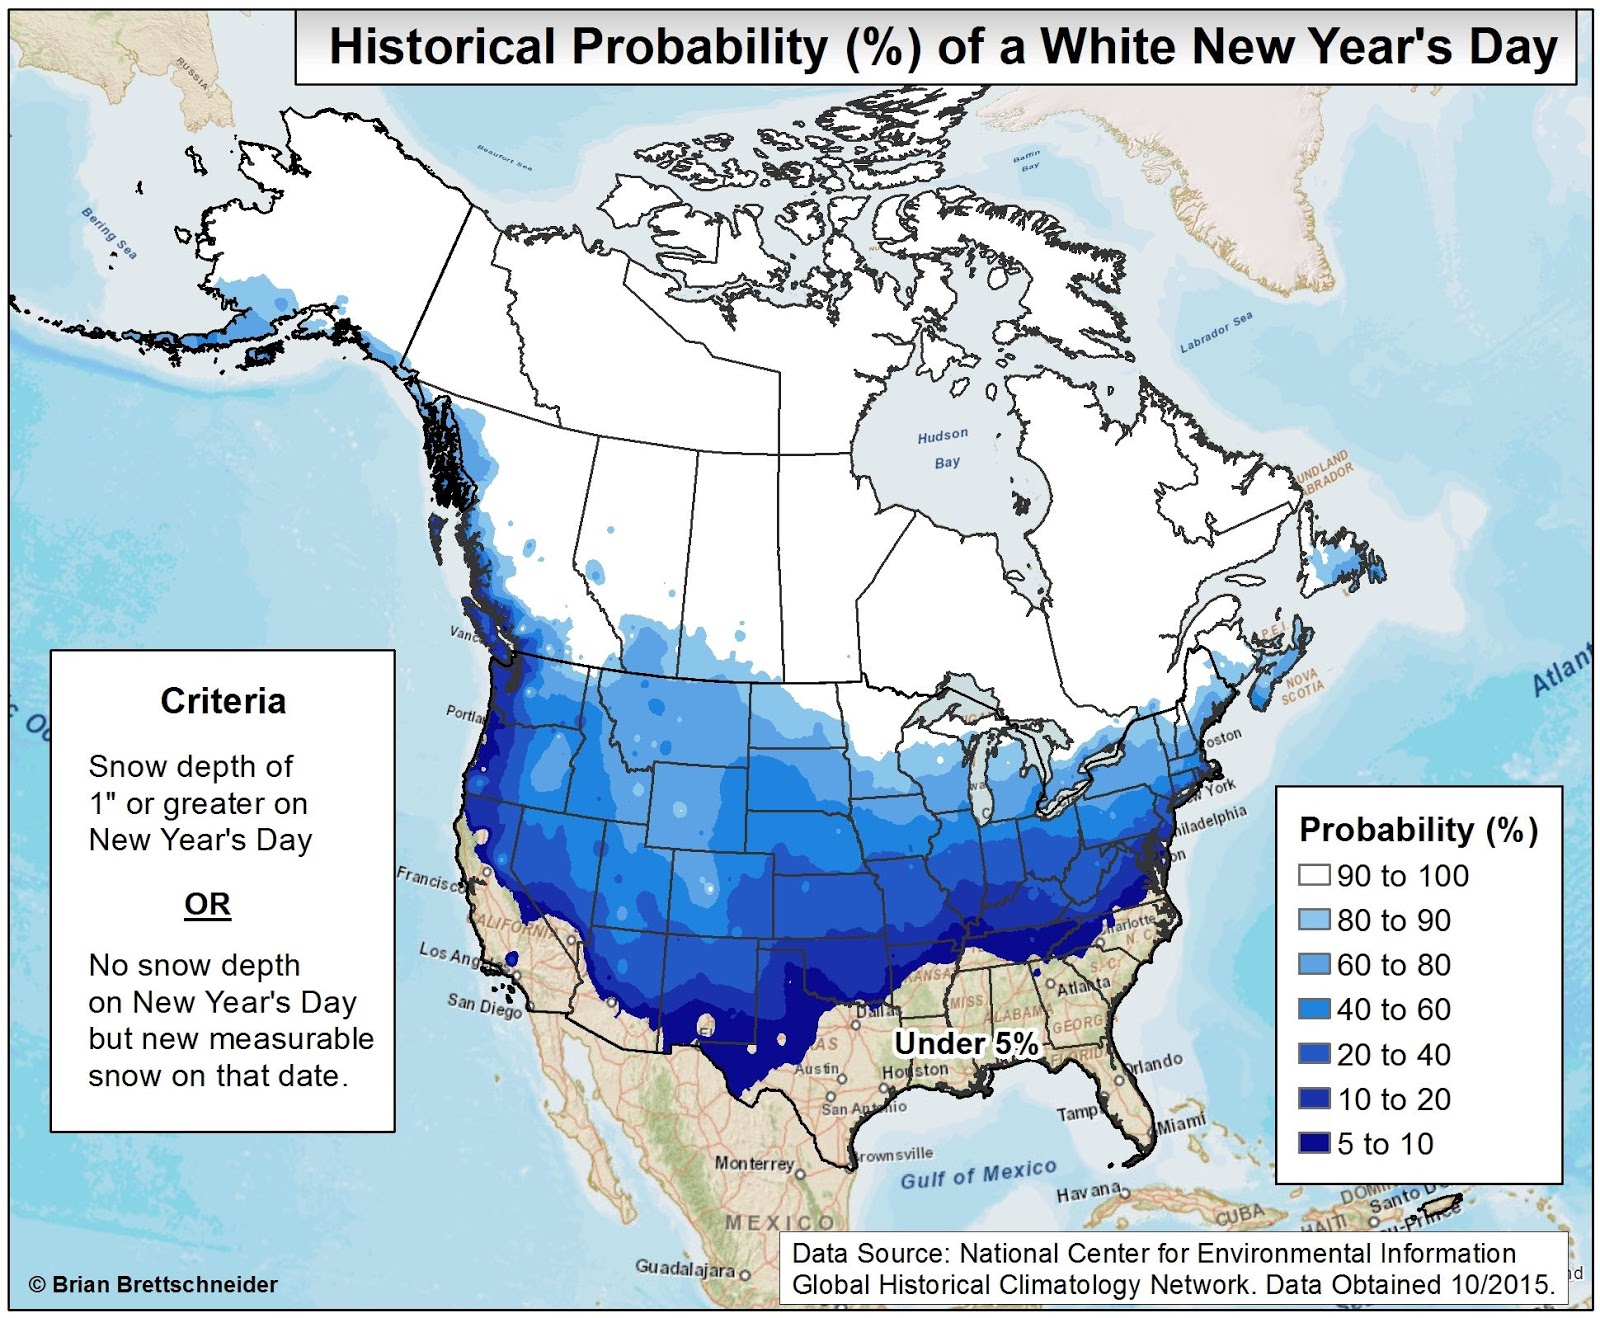
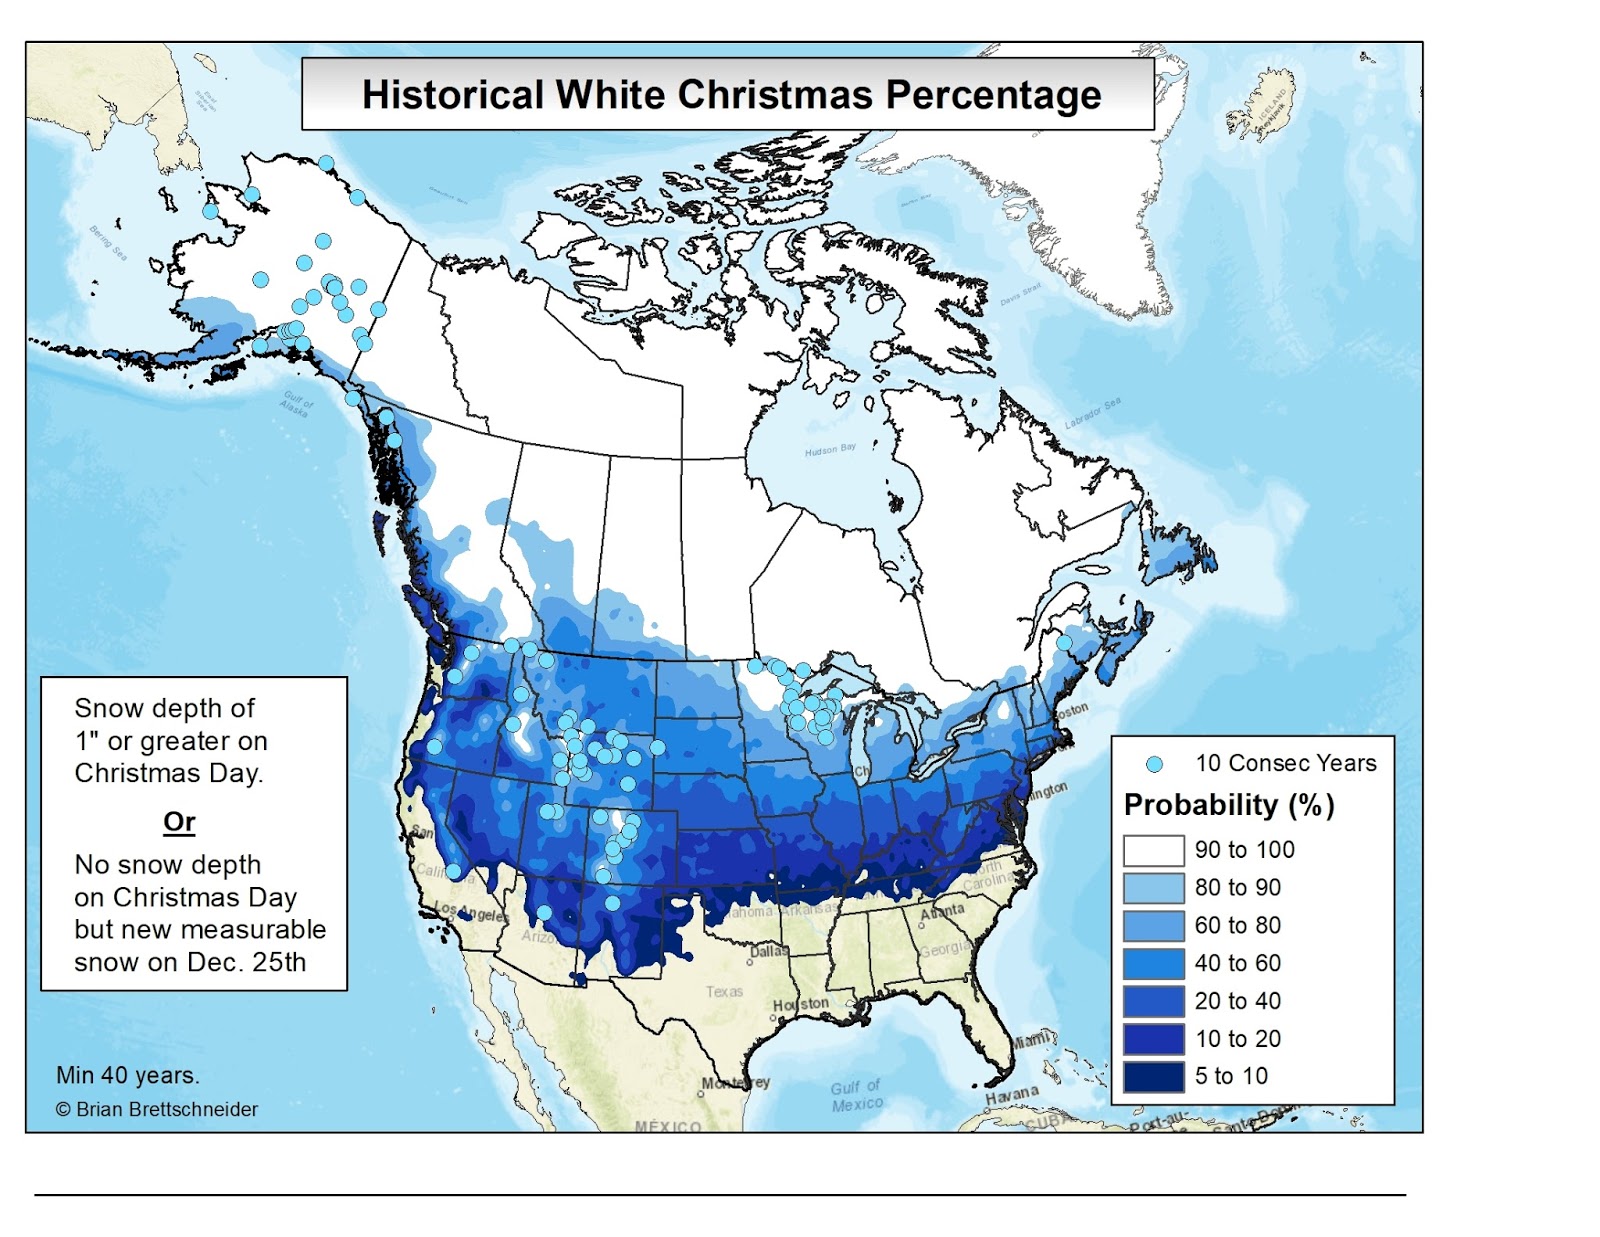
AB) Historical chance of measurable snow on Christmas Day. LINK 


AC) Stations that have ever had a White Christmas. LINK


Friday, December 1, 2017

Defining the Seasons

What is a season? Well, if you look at a calendar, the seasons start on December 21, March 20, June 21, and September 22. These are more properly called astronomical seasons. Climatologists traditionally use whole calendar months to describe the seasons – December to February, March to May, June to August, and September to November. These are called climatological seasons. Most natural scientists use these month-based season definitions.

Season Definitions

Surprisingly, very little research has been done on using climatological data to fine tune the definition of the seasons at the local scale. When I looked a few years ago, I only found a single paper in the peer-review literature that specifically looked at reshuffling the dates where the seasons begin (citation pending). This effort only attempted to assess whether the 90-92 days seasons actually line up with the calendar months. They showed that it was actually not that far off.

More recently, Boustead et al. (2015) used an elaborate rubric to define the winter season using temperature, snowfall, and snow depth – the AWSSI. Their definition of winter was expansive and made sure to capture the maximum length of wintry condition. In March/April, a measurable snowfall extended the winter season until (at least) the day of the snow – and longer if it stayed on the ground. However, an argument can be made that multiple days in the 60°s/70°s during March that are followed by a quick snowfall does not mean those days in the 60°s/70°s are part of winter. The AWSSI bins them in the winter season. This is not a flaw of the AWSSI; as the AWSSI's goal is to capture all winter conditions.

The Data

I used the Global Historical Climatology Network version 4 (GHCNv4) database of monthly climate temperatures for all analysis. Here comes an important point. Climate normals are based on monthly temperatures. This seems counter intuitive. Why not use daily data if we have it? The answer is that daily data are chaotic. In addition, many stations collect data at irregular schedules that make daily estimates difficult but are good at the monthly level.

Up through the 1971-2010 climate period, the National Center for Environmental Information (NCEI), formerly the National Climate Data Center (NCDC), used a cubic spline fit of monthly average temperature to interpolate daily climate normals. In the 1981-2010 climate period, they modified the procedure somewhat using a methodology that is explained in some detail but in a way that is not replicatable.

For my analysis, I used 1981-2010 monthly temperature data and applied the cubic spline technique that NCEI used in prior climate normal periods. The daily values produced are not very different than the non-replicatable NCEI published values. With that caveat ...

Adjusting Cold 90-Days and Warm 92-Days

The December 1 to February 28 time period is 90 days long (I am ignoring Leap Days). Is this really the coldest 90 days of the year? Correspondingly, the June 1 to August 31 time period is 92 days long. Is this really the warmest 92 days of the year?

These are questions that have long interested me. To answer the question, I generated daily normal temperatures for every U.S./Canada station in the GHCN v4 data set (7,636 stations). For each of those station, I flagged the coldest 90 days of the year and the warmest 92 days of the year. The seasons are therefore redefined as:

1) Winter: coldest 90 days
2) Summer: warmest 92 days
3) Spring: days between winter and summer (undetermined length)
4) Fall: days between summer and winter (undetermined length)

The length of winter and summer are fixed and the combined length of spring and fall are fixed – but the length of spring and fall as individual seasons vary from place to place.

Figures 1-4 below show the dates of winter and fall, and the lengths of spring and fall using the aforementioned methodology. Figure 5 shows a sample of stations with the start and end dates of all seasons using a color-coded index.

Figure 1. Coldest 90-day period of he year during 1981-2010 using climate normals generated from the GHCN v4 data set.

Figure 2. Warmest 92-day period of he year during 1981-2010 using climate normals generated from the GHCN v4 data set.

Figure 3. The number of days between the coldest 90-day period and the warmest 92-day period. This is the length of spring. 

Figure 4. The number of days between the warmest 92-day period and the coldest 90-day period . This is the length of fall. 

Figure 5. Graphical representation of the begin/end dates for 63 selected cities in the U.S. using the coldest 90-day period, the warmest 92-day period, and the intervening periods. 

 Defining Seasons Using Annual Temperature Range

Instead of retaining the length of climatological seasons to mimic the length of calendar months, why not define some temperature thresholds for the warm and cold seasons and let the chips fall where they may? This is an idea the Rick Thoman with the National Weather Service Alaska Region came up with. He suggested that if you took the annual range of normal temperatures (highest minus lowest), those days that are in the top 1/4 of that range are summer days, those days in the lowest 1/4 of that range are winter days, and the intervening days are either spring or fall days.

This produces a much different distribution of season lengths. Most places "hover" near the warmest and coldest portions of the year for more than 90 or 92 days. For example, the annual maximum normal for Washington D.C. (Dulles) is 76.7°F. The annual minimum normal is 33.1°F. The range is therefore 43.6°F. Any days warmer than 65.8°F are considered summer and any days below 44.0°F are considered winter. The transitions between those periods is considered spring and fall. This yields a winter length of 114 days, a summer length of 119 days, a spring length of 69 days, and a fall length of 63 days. Note the dramatically longer lengths of summer and winter compared to the 90- and 92-day lengths from the previous section.

Because both the start date and the lengths of summer and winter are variable using this methodology, we cannot have a single figure (like Figures 1 & 2) that gives all the necessary information about those seasons; therefore, I just show the lengths of the four seasons in the map set below. Figures 6-9 below show the dates of winter and fall, and the lengths of spring and fall using the top/bottom temperature quartile methodology. Figure 10 shows a sample of stations with the start and end dates of all seasons using a color-coded index. It is the exact same set of stations that were shown in Figure 5 above.

Figure 6. Length of the winter season using the quartile methodology and based 1981-2010 using climate normals generated from the GHCN v4 data set.

Figure 7. Length of the summer season using the quartile methodology and based 1981-2010 using climate normals generated from the GHCN v4 data set.

Figure 8. Length of the spring season using the quartile methodology and based 1981-2010 using climate normals generated from the GHCN v4 data set.

Figure 9. Length of the fall season using the quartile methodology and based 1981-2010 using climate normals generated from the GHCN v4 data set.

Figure 10. Graphical representation of the begin/end dates for 63 selected cities in the U.S. using the quartile season definition methodology.


Thursday, September 28, 2017

Map Collection


**********
A) Temperature maps (percentiles, medians, and averages).


***********
B) AWSSI


***************
C) Daylight & Twilight


***************
D) Record Consecutive Temp & Precip Days


***************
E) Wettest / Driest  Months & Seasons


 *****************
F) Rick's Wet Season Index


 *****************
G) Holiday Climatology


 *****************
H) Eclipse Maps


 *****************
I) Precipitation Percentiles


 *****************
J) Precipitation Recurrence Intervals


 *****************
K) Defining Seasons


 *****************
L) ESRL Rankings Website Output


***************
M) Days per Year Threshold Count


***************
N) First/Last Temperature Date


****************
O) Single Year/Season Analysis


*****************
P) Snow Depth


*****************
Q) Seasonal Midpoints


****************
R) Change Across Time Periods


***************
S) All-Time Extreme


***************
T) Severe Weather


****************
U) Random Stuff