Friday, September 26, 2014

Alaska Rainfall Record

Over the last several years, we have embarked on a long, strange journey to fix an error in the Alaska climate record. Not just any error, but a state record error. The culmination of this process is an article in the August 2014 issue of the Bulletin of the American Meteorological Society (BAMS). The .pdf document can be viewed directly from their website here. The document is free of charge and there is no registration required to access the article. The next several paragraphs will describe what happened, how it is being corrected, and what happens next.

Back in 1982, in the Native Village of Angoon, in Southeast Alaska, a Cooperative weather observer recorded 15.20" of rain in a single day. This remarkable value was entered on to a monthly form and submitted to NOAA (via mail) for transcription and archiving. Once this value was entered into the system, any database query could identify it as the single greatest 24-hour precipitation event in Alaska history. Because Angoon is located in Southeast Alaska, one of the wettest regions in the world, it was assumed that this staggering total was entirely plausible – even though Angoon lies in a rain shadow and is the driest location in all of Southeast Alaska.


Figure 1. Location of Angoon, Alaska.


Figure 2. Aerial view of Angoon from fixed-wind aircraft.

By sheer coincidence, in 2009 I began working for a company that was involved in drafting an Environmental Impact Statement for a proposed land-based airport in Angoon. When I came across this 15.20" precipitation event, something didn't seem right about it. Doing a little digging I came across the original observer form from 1982. The precipitation total on October 12th clearly indicates a reading of 15.20".


Figure 3. Scanned observation form from Angoon for October 1982.

Knowing that the average annual precipitation for Angoon was around 35" - 40", it did not seem possible that nearly half the annual precipitation could fall on a single day. That only happens in desert areas. In fact, when all of the precipitation totals for a 12-month period were added together for Angoon in 1982, it came out to over 200". Clearly something was amiss. But what was it?

Surely this type of outlier would have been noticed in the previous 30 years, right? Perhaps it was. However, no one had fully documented the process. Therefore, I set out to write-up my findings and pass it along to the NWS in Juneau. As fate would have it, Carl Trypaluk, who was working with NOAA in Silver Spring, Maryland, had also noticed this observation while developing new precipitation recurrence intervals as part of the NOAA Atlas 14 project. Carl wrote up his findings and also sent it to the NWS in Juneau shortly before I had done so. Since we both had researched the same error at nearly the same time, we decided to join forces and investigate further.

What happened

As luck would have it, the gentleman who recorded the precipitation at the time is still alive and was willing to talk with me about it from his home in Ketchikan. What kind of luck is that! It turns out that the long-time observer in Angoon had passed away the previous year and the gentleman now in Ketchikan continued the observations to preserve the data continuity. Unfortunately, before he was able to be trained by the NWS staff in Juneau, he collected several months of precipitation data using an incorrect measurement technique – which magnified all precipitation readings by a factor of 10. In hindsight, the 15.20" should have been 1.52". 


Figure 4. Location of the observation station in 1982. The station burned down c. 1985. The red box shows the approximate footprint of the building that the station was next to.

Changing the record

Purging a record from the books is not an easy task. There is a tremendous inertia that must be overcome. The National Climate Data Center (NCDC) has a procedure for evaluating state records. It involves the formation of an ad hoc committee to evaluate all relevant information. The committee then decides whether or not to accept or reject the validity of the record. In the case of Angoon, a committee was formed and the recommendation of the committee was to strike the Angoon record from the books. Now, the Director of the NCDC must sign-off on the recommendation. Presumably that will happen sooner rather than later. However, changing the record is a two-step process. Step 1 was resolving the status of the Angoon record. Step 2 is declaring a new state precipitation record. Step 1 is nearly complete, but Step 2 .....

Seward, Alaska

In the Olympics, when the winner of an event is disqualified after the fact, the second place finisher is promoted into first place and is awarded the gold medal. Once the Angoon record is moved out of first place, who gets to move up? The answer is Seward. They received 15.05" of rain on October 10, 1986.

On October 3rd, the State Climate Extreme's Committee concurred with our findings and placed Seaward at the top of Alaska's precipitation record list.

Figure 5. Rainfall totals in Southcentral Alaska on October 10, 1986. The value for Seward is circled in red.

How do the people of Seward feel about this? There's a saying that as long as the weather is extreme, you might as well set a record. However, the Chamber of Commerce might not want the designation of having the wettest day in Alaska's history. Whatever the case, records are an important part of the climate history of Alaska and every other place in the world. We need to know the bounds of the climate system to make effective public policy decisions. Fixing this record is a small contribution toward that goal.

Note: Figures 1, 2, 4, and 5 are copyrighted by Brian Brettschneider. Figure 3 is courtesy of NOAA.

Sunday, September 7, 2014

Alaska September Daily Temperature Change

jQuery Before/After Plugin Demo These slider images show the 30-day change in temperatures between the beginning and end of Septemper. The top image shows the high (max) temperature change and the bottom image shows the low (min) temperature change.
before
after
before
after

Tuesday, September 2, 2014

Wettest Month of the Year

When is the wettest month of the year? The answer to that question depends greatly on where you live. If you live along the West Coast, the answer is probably one of the winter months. If you live in the Great Plains, the answer is likely one of the summer months. There are a myriad of reasons for this temporal and geographical disparity. They include: solar heating, jet stream position, sea surface temperatures, upper level patterns, and so on. In some instances, the distribution of annual precipitation is quite uniform and no straightforward seasonal pattern exists. In those cases, the variation between nearby stations can appear chaotic.

Methodology:

To make the maps shown in the figures below, we used the NCDC 1981-2010 normal monthly precipitation values for 8,535 stations in the 50 states. For each station, the month with the greatest normal precipitation was identified. There were 98 stations that had a tie for the wettest month and 1 station with a three-way tie for the wettest month. In the monthly maps that begin with Figure 4, stations that were tied are shown in any month where the tie exists.

Nationwide Wettest Months and Seasons:

Before we begin with the map set, please take the opportunity to download a Google Earth file with all 8,535 stations that are color coded by the wettest month. Each station's monthly precipitation data can be viewed by clicking on the station's marker. 

The first 3 figures show the wettest climatological season (Figure 1) and the monthly peak precipitation values (Figures 2, 3).

Wettest Season:

If we define the seasons by traditional climatological boundaries (Dec-Feb, Mar-May, Jun-Aug, and Sep-Nov) and add up the normal precipitation values for each of those time periods, we can easily identify which season is the wettest. Figure 1 shows the result of that analysis. Since there are only four categories, the seasonal boundaries are quite easy to discern. The West Coast has a winter precipitation peak and most of the rest of the country sees a summer peak – with the notable exception of an area bounded by Central Texas to the Ohio River Valley to the Deep South.


Figure 1. Dot map of wettest climatological season of the year. 8535 stations were used to make this map.

Wettest Month:

Unlike the seasonal map, the combined monthly maps are much more difficult to visualize. That being said, it is important to distinguish between a January peak and a December peak (for example). Figures 2 and 3 show the station breakdown by calendar month – one as a dot map and the other as a color scale (choropleth) map. For example, the Spring maximum noted in Figure 1 is shown in Figure 2 to be nearly entirely composed of stations whose wettest month is May. To the west of the May stations, a large area of June stations exist. While the seasonal map showed a significant break in the region, it is relatively minor when looking at the monthly data. However, a sharp transition to Winter peak values exists to the east of the May stations. Again, having the monthly values is important for this type of assessment.


Figure 2. Dot map of wettest month of the year. 8535 stations were used to make this map. If a station had more than one wettest month, the month closest to its neighbors was chosen.


Figure 3. Continuous map of wettest month of the year.

Individual Months:

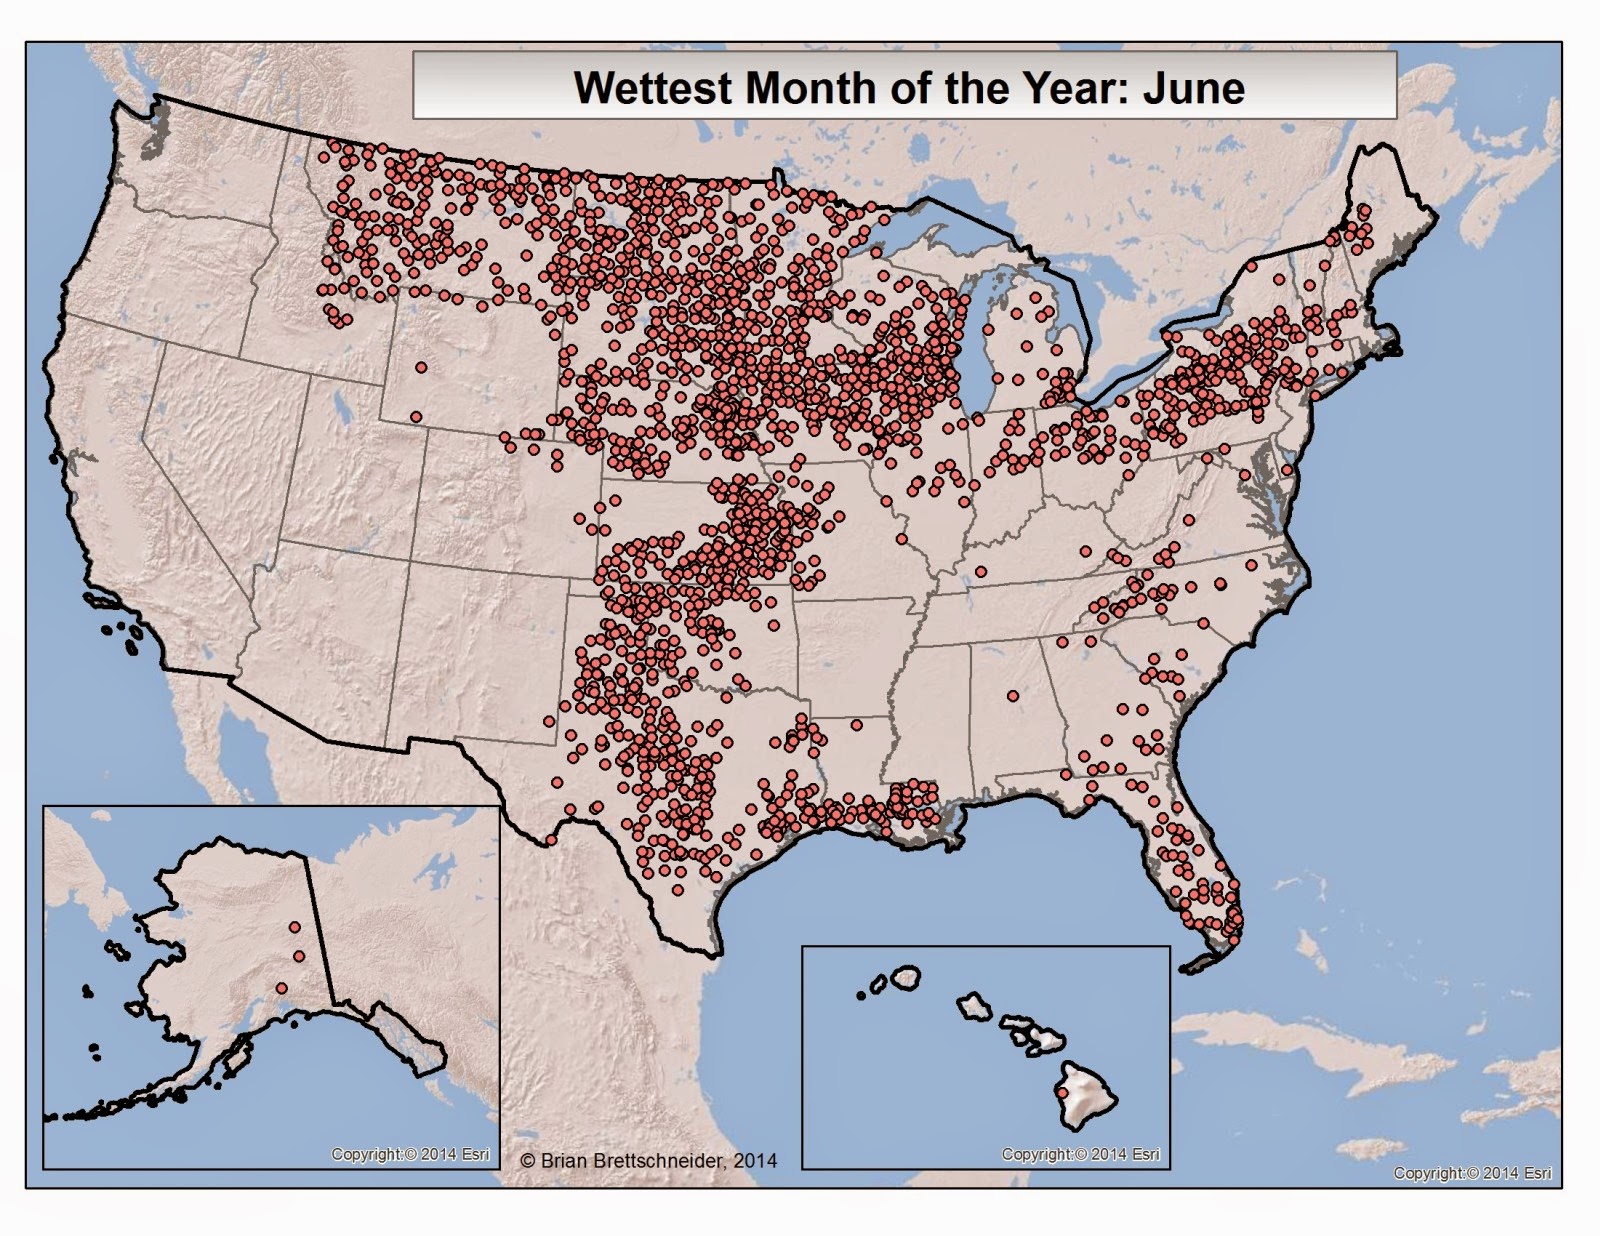
Instead of trying to decipher (often) complicated patterns, I though it useful to have an individual map for each month of the year. In the following 12 figures (Figures 4 through 15), each month of the year is pulled out individually. Only those stations with a peak precipitation value in that month are shown. If a station has a tie for the peak month, it is shown on all maps for 
which a tie exists. 
Figure 4. Stations where the wettest month of the year is January (n=277).

Figure 5. Stations where the wettest month of the year is February (n=332).

Figure 6. Stations where the wettest month of the year is March (n=263).

Figure 7. Stations where the wettest month of the year is April (n=76).

 Figure 8. Stations where the wettest month of the year is May (n=1,881).

Figure 9. Stations where the wettest month of the year is June (n=2,053).

Figure 10. Stations where the wettest month of the year is July (n=1,073).

Figure 11. Stations where the wettest month of the year is August (n=916).

Figure 12. Stations where the wettest month of the year is September (n=438).

Figure 13. Stations where the wettest month of the year is October (n=339).

Figure 14. Stations where the wettest month of the year is November (n=333).

Figure 15. Stations where the wettest month of the year is December (n=653).

Intra-Annual Variability:

In many cases there are substantial difference between wet and dry months. Some stations in California and Alaska receive 60% of their annual precipitation in a three-month window. On the flip-side, many stations in the Northeast and mid-Atlantic have precipitation evenly distributed across all months.

The final map in this blog post (Figure 16) shows the month-to-month variability in precipitation values across the year. To make this map we calculated the difference between the NCDC normal precipitation for each month and compared it to the value that would occur if each month received 1/12th of the annual precipitation. This type of assessment is called a goodness-of-fit test. In this case we used the Chi Square goodness-of-fit-test.

As you can see, some areas have low month-to-month variability and others have quite a bit. I had assumed that all cold regions would have low winter precipitation values due to the moisture capacity of the air being greatly reduced. However, that is only the case in the Northern Great Plains and Alaska – not in New England. The other quite surprising finding is the low month-to-month variability in the Great Basin. Perhaps this is an artifact of multiple synoptic-scale parameters in other regions that all converge in this region.

There are far too many patterns in this map to describe. It is worthy of its own blog post another day!
Figure 16. Intra-annual variability based on monthly totals. Stations with consistent precipitation values throughout the year are shown in green and stations with large month-to-month variation (e.g., distinct wet and dry seasons) are shown in red.